Geomatic Tools for Water Management in a Community Irrigation System, Cruz del Eje, Córdoba.
Abstract
An integral and efficient management of water for irrigation requires the adoption of new technologies to respond to the challenges imposed by the agricultural sector, in particular to stabilize production through the adequate use of water resources. In this sense, it is vital to characterize and know the amount of area which is under irrigation in such agricultural systems. In this paper we show the use of satellite information data in a GIS environment with the objective of characterizing the productive areas under irrigation in Cruz del Eje, Córdoba, Argentina in 3 types: A) irrigation region B) irrigable area and C) actually irrigated area. Multitemporal image indices and segmentation were used for this characterization and then maps of these 3 types of agricultural land cover were generated. Additionally, we present simple satellite images processing and classification procedures to increase the knowledge about the land cover over this irrigated area. Finally, we discuss how this geographically explicit information generated could be useful for the decision-making process on current irrigated areas and on the potential of productive systems through community irrigation systems.
Author Contributions
Academic Editor: Abubaker Haroun Mohamed Adam, Department of Crop Science (Agronomy), College of Agriculture, Bahri University- Alkadaru- Khartoum -Sudan.
Checked for plagiarism: Yes
Review by: Single-blind
Copyright © 2019 M. Victoria Marinelli, et al.
 This is an open-access article distributed under the terms of the Creative Commons Attribution License, which permits unrestricted use, distribution, and reproduction in any medium, provided the original author and source are credited.
Competing interests
The authors have declared that no competing interests exist.
Citation:
Introduction
The use of water as an asset of great utility and high abundance in absolute terms, was globally extended until the 1970s 1. With the advent of intensive agriculture, the concept of water as a resource changed from being only vital and irreplaceable to the most important factor of production and, therefore, an asset subject of appropriation. The irrigated area worldwide quintupled from the second half of the 20th century onwards, reaching 267 million hectares under irrigation 2. This area represents a 15% of the total cultivated area and it is estimated that 37% of the total crop production is obtained in irrigated areas 3. In Argentina, the arid and semi-arid regions were the ones that used irrigation the earliest, first through the use of surface water resources and then with the use of underground ones. These areas show how irrigated agriculture consumes a great percentage of total catchment water, a percentage that exceeds 90%. These data along with the potentially irrigable area of Argentina (more than 6 million ha, currently cultivated under irrigation only 1,635,000 ha) places irrigation as a keystone for water and territory management, demanding adequate and sustainable planning.
Argentina does not have reliable and updated statistics on irrigated areas, and less so on its characterization, technological and temporal evolution 1. In 2002, the National Agricultural Census reported 1,350,000 ha with irrigation, FAO 1,630,000 ha in 2010 4 and the Provincial Agricultural Services Program 5,6 estimated 2,200,000 ha in 2012.
The fruits and vegetables sector of Córdoba province represents 16% of national production 7. The production is located mainly in the Capital, Colón, Cruz del Eje and San Javier departments. Official data on irrigated areas in Córdoba province are briefly described by the Secretariat of Water Resources (1995), as: Córdoba green belt 17,000 ha; Traslasierra 13,000 ha; Cruz del Eje 11,500 ha and Villa de Soto 1,000 ha. Despite the economic benefits that irrigated agriculture entails in these areas, conflicts derived from deficient allocation and management of the resource highlight cases of excessive investment, inequity, overexploitation and loss of ecosystems 1.
The northwest region of Córdoba, has 66 water systems integrated by basins and micro-watersheds capable of capturing and driving the rainwater mainly used for agricultural purposes. The 10 largest of these, have dams and reservoirs. The irrigation systems nourished by them are regulated by consortiums, but still water management is not efficient and important territorial conflicts have arisen. In particular, in the irrigation systems of Cruz del Eje and Pichanas, less than half of the flow that must reach the farm gate is available.
In this framework, we present a case study applying the methodology for characterization of irrigated areas 8, which operates through a generation model collaborative of cartographic information assuring the premises of quality, standardization and compatibility. This inter-institutional effort was developed with the aim of building a database of common use that would allow knowing the number of farmers, their distribution and the irrigated area. The specific goals were then to characterize the systems under irrigation in 3 types: A) irrigation region B) irrigable area and C) actually irrigated area. Additionally, this work explores the use of remote sensing (RS) tools in order to characterize the irrigation area and its context. Finally, we discuss how this kind of geographic products and the methodology presented could be useful for decision-making regarding the horticultural production in Cruz del Eje. It is important to remark that the use of simple and accessible tools allow this technique to be usable in operational frameworks.
Materials and Methods
Study Area
The study was carried out in the Northwest of Cruz del Eje department (Figure 1), located approximately 150 km north from Córdoba city. The area has a warm and humid climate, with more than 300 days of sunshine per year; with a rainy season that extends from October to March and a dry one between April and September. The summer is warm and humid, while the winter is dry and not very harsh. Thus, in the extreme south, at higher altitude, the average maximum temperature is 14 ºC and the precipitations exceed 800 mm, while in the Salinas, the thermal values exceed 27 ºC and those of precipitation are less than 400 mm 9.
Figure 1.Study Area. Irrigation Region of dike Cruz del Eje, Córdoba, Argentina.
A dike supplies water for irrigation (Lat. -30° 64' and Long. -64° 30'). The maximum height of the reservoir is 111,985 Hm3. Potential irrigation is 12,050 has. The average annual rainfall of the basin is around 580 mm, the surface of the basin of contribution is 1,700 km2. The system has two margins of Cruz del Eje River and 16 Channels 10. The soils have a frank-silty structure. They have a little evolved structure and the content of organic matter oscillates between 1.5-3% that decreases considerably in the inferior horizons. The existing water deficit in the region causes a huge evapotranspiration and low effective humidity in the soil profile 9, 11.
Temporal Series of Satellite Images
Throughout the year, irrigated crops have different characteristics among each other and from rain feed ones, either because of its phenological growth, or because of the management they are subject to. Based on this idea, Landsat OLI 8 satellite images from three dates (each agricultural year) were selected to explore the annual cycle according to the management and phenology. A winter date (June-July), and two spring-summer dates (October and December-January). It was done for 3 agricultural cycles including then the following image data set: 2013-07-28, 2014-01-04, 2014-06-29, 2014-08-16, 2014-12-06, 2015-03-28, 2015-06-16, 2015-08-03, 2015-09-04, 2015-10-22, 2015-12-08, 2016-01-18, 2016-05-01.
All these products were calibrated to reflectance. For each image, vegetation spectral indexes (NDVI, NDWI and SAVI) were calculated in order to observe which of the indexes is most useful for the identification of irrigation area. Finally, only the NDVI (Normalized Difference Vegetation Index) 12 was used because it is a good estimator of the photosynthetic activity of the canopy of vegetation and, therefore, of primary productivity. Many studies have used the NDVI to identify types of crops in areas under irrigation 13.
Specifically, to detect the presence of crops under irrigation, a map of agricultural plots (2,523 polygons) was built (e.g. 14,15,16,17) through visual digitalization at 1:25,000 scale using Google Earth® images. For each digitized plot, the average value of NDVI calculated on the dates analyzed (average of pixels within the polygon) was assigned. An example of the product obtained following this procedure is presented in Figure 2. This methodology allowed us to identify the distribution of agricultural parcels with different levels of primary productivity and their temporal behavior.
Figure 2.Zoom in to the Agricultural Parcels Map, showing average behavior of the NDVI June 2014 (Landsat 8_OLI).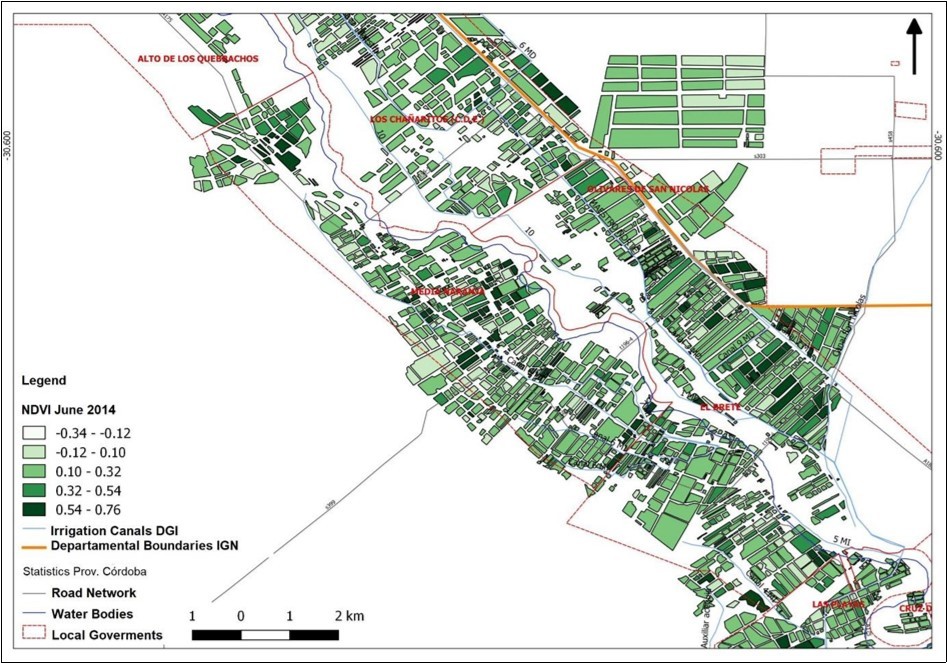
Then, based on the NDVI values assigned to each polygon, those that presented their annual maximum (constructed from 3 annual images) lower than the minimum NDVI value of the polygons on the ground truth irrigated fields (information provided by rural extension agency of Cruz del Eje) were filtered. For validation, another 14 horticultural plots were taken as a test set, yielding 100% accuracy. (Figure 3).
Figure 3.Flowchart of temporal series of index satellite images.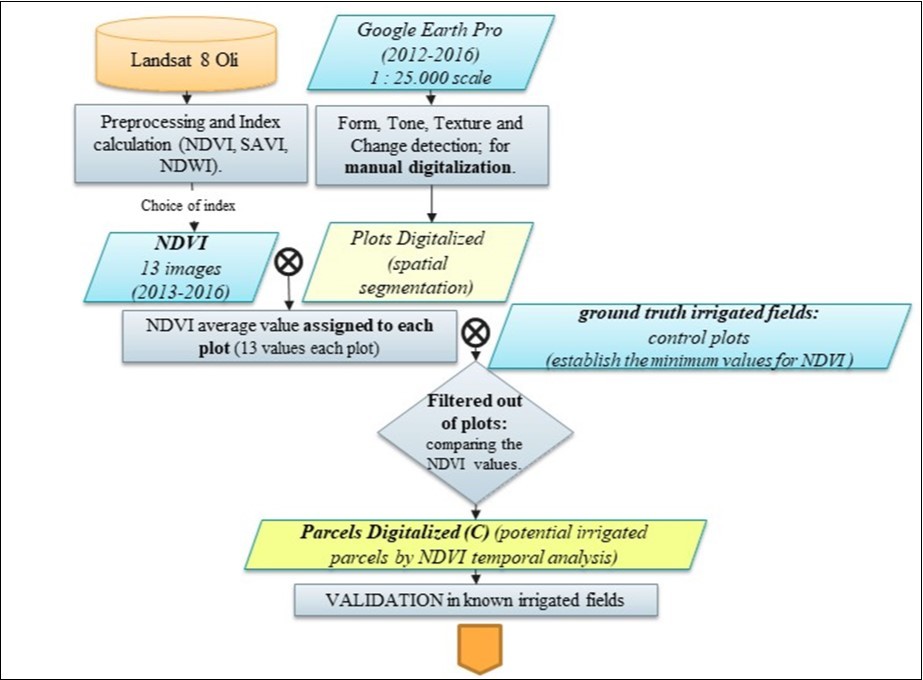
Data Bases
For the analysis and typological classification, we adopted the definition generated by INTA in their project entitled “Water management and irrigation for sustainable development of the territory” (Gestión del agua y el riego para el desarrollo sostenible del territorio, PE 1133044) on actual and potentially irrigated areas.
Definitions
A. Irrigation region: This term refers to a geographical space where the socio-economic development results from the management of its available water resources, covering aspects of production, distribution, protection, in balance with the social, historical, cultural and economic issues. It is represented by a surrounding polygon that delimits land with agricultural / livestock use and within which the dominant class is irrigated crops.
B. Irrigable area: It corresponds to all that surface within an irrigation region that has potential to be irrigated. To define irrigable areas, the following criteria were considered: i) access to water, ii) irrigation system in conditions to be used, iii) irrigation aptitude. In this case the "cadastral domain" is stipulated as a unit of analysis and work.
C. Actually irrigated area: Corresponds to the lands that are being irrigated at a specific time. Thus, the area irrigated in a territory during spring is different from the area irrigated during summer, since we find different crops with significant variations of phenological cycle and agricultural management. These areas will be within the irrigable area and may coincide with it or be smaller.
The actual field data of horticultural farmers (polygons/plots) is obtained by grouping three different data sources:
Layer A
KML Layer Cadaster 2016. The KML data was exported to the shape file format using QGIS software 18. An attribute table was created with 294 data and the polygon called "new irrigation zone". The table contains two columns: property tax number and description, name and surname, DGI account number and amount of water assigned.
Layer B
Summary registration form. It contains 410 records (surname and first name, property tax number and description, DGI account number, area, channel, amount of water assigned and consortium account)
Layer C
Map of digitized agricultural plots with phenological data from the NDVI temporal series (See section II.2).
The final datasheet generated on the base of these several data sources was provided by the people in charge of granting the irrigation shift, called "llaveros". Together with llaveros, we performed visits to farmers within the irrigation system and recorded irrigated fields with GPS. (Figure 4).
Figure 4.Flowchart of SIG and Data Bases.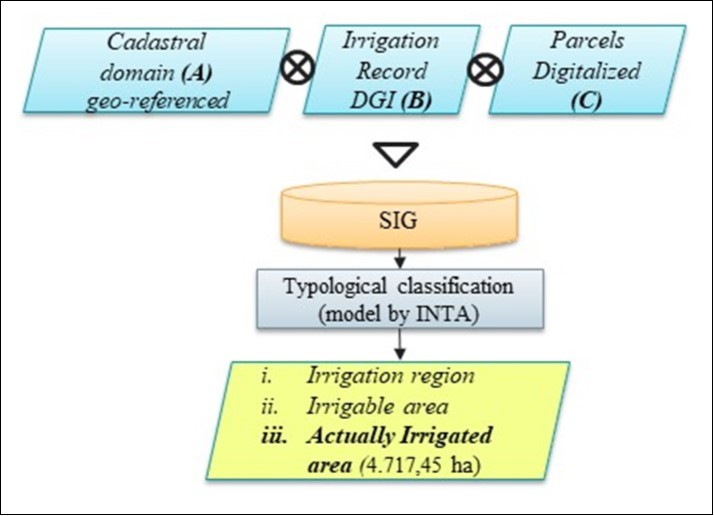
Land Use/Land Cover Classification
Four classifiers were explored on a Sentinel 2A image, pre-processed to surface reflectance. We worked with the bands blue B2, green B3, red B4, three red edge bands B5, B6, B7, near infrared (NIR) B8 and two SWIR bands B11 and B12. All of them were resampled to a spatial resolution of 10 m. The image corresponds to June 7, 2016 presenting cloudiness percentage of less than 40%. The campaign to obtain ground truth points was carried out on July 19, 2016.
We classified the image in the software ENVI 4.8 © (CONAE license). Two unsupervised classifications were used (ISODATA and K-MEANS) instantiated with default values, assigning 5 to 15 classes in the search with 400 iterations (ISODATA) and 10 classes in the same conditions (K-MEANS). The urban area of Cruz del Eje was masked out. The unsupervised classifications are those in which the classifying algorithm does not need more information than the image and some parameters that limit the number of classes. These classification mechanisms search for classes with sufficient spectral separability to differentiate some elements from others 19,20,21. These classifications were used as a first approach to the spectral characteristics that allow to differentiate coverages.
In terms of supervised classification, the Support Vector Machine (SVM) algorithm of ENVI 4.8 © was used, with a Radial Basis Function type kernel. The algorithm was trained with field data taken with GPS on June 19, 2016; with 1089 pixels (57 polygons) to determine 5 types of coverage: Water and artificial cover (construction); Seminatural (pastures, shrubberies, buffel grass not irrigated, stubble-corn and cotton); Bare soil (bare soil and plowed earth); Irrigated herbaceous (horticultural, alfalfa and winter green); Irrigated Trees (pomegranates, olive trees and water boundaries trees).
In order to determine the accuracy of the resulting maps, we computed the confusion matrices, using 30% of the ground truth points (728 pixels in 25 polygons) as a validation data set. The Global Accuracy and Kappa Statistic (K) 21 were calculated. The kappa coefficient computes the agreement between the classified image and the ground truth, due solely to the accuracy of the classification, suppressing the agreement that could be expected simply by chance 22. In 23 a scale was proposed for the interpretation of the K where values lower than 0.40 are considered a poor classification, 0.40-0.55 sufficient, 0.55-0.70 good, 0.70-0.85 very good and greater than 0.85 excellent. We used the caret library 24 from R software 25 ensure that the distribution of classes is the same in training and test data sets.
The other supervised classification model applied is Random Forest (RF), an automatic algorithm in which decision tree models are iteratively adjusted to random subsets of the input data and use the combined result for prediction 26. With the processed image and the set of real field polygons; a RF model was applied. We used the R random Forest package 27 that implements the classic Breiman algorithm 28. (Figure 5)
Figure 5.Flowchart of Land Cover/Land Use classification satellite images.
Results
Typological Characterization Using GIS Tools
On the base of the available data sources and the geographic link between them, we can obtain 3 GIS layers: i) irrigation region delimited by the official province administration presented in Figure 3, ii) irrigable area that is the union of census and registration forms (Layer A + Layer B) presented in Figure 4, and iii) actually irrigated area, presented in Figure 5, which is generated by the intersection between digitized agricultural parcels and irrigable area.
Next, the adopted criteria for the delimitation of the proposed products are described with more detail:
Irrigation Region
It is the geographical space where the socio-economic development results from the management of its available water resources. Essentially it contains agricultural land use. It is represented by a surrounding polygon that delimits it. This area may contains other kinds of land use 1. The area surrounds Cruz del Eje river, and the system has two margins (left and right) and 16 channels. (Figure 6).
Figure 6.Irrigation Region on the Cruz del Eje System.
Irrigable Area
It is built summing all the surface contained within an irrigated region, with potential to be irrigated, according to the following criteria: i) access to water, ii) irrigation system in conditions to be used, iii) irrigation aptitude. The "cadastral domain" is defined as the unit of analysis and work. The sum in terms of area of each cadaster domain identified as a unit of irrigable area will ultimately constitute the irrigable area of a certain irrigated area. The layer is obtained by the union of Cadastral information matrices, DGI registration and consortium account. (Figure 7)
Figure 7.Irrigable area on the Cruz del Eje System.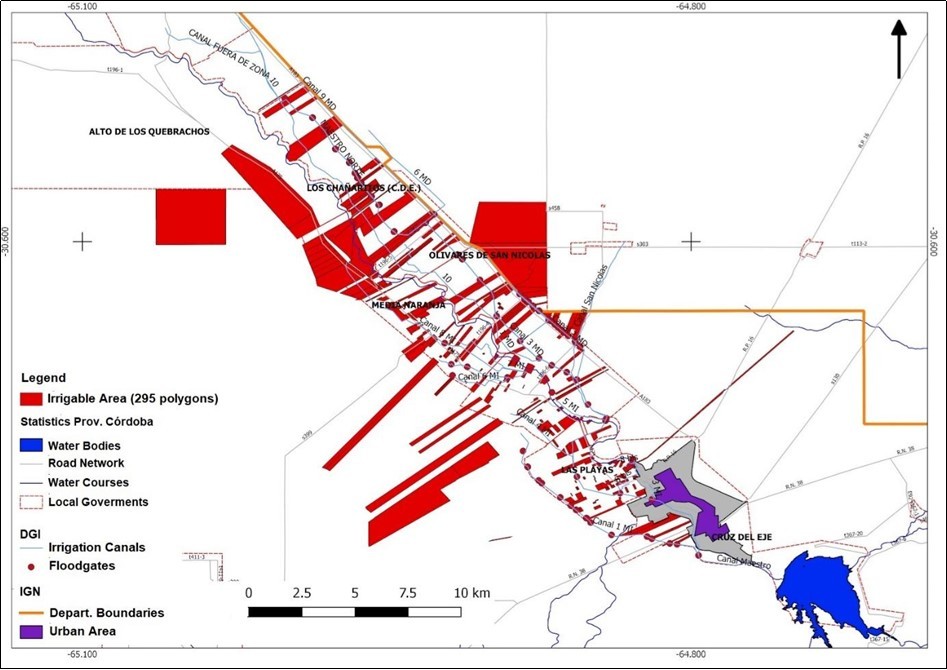
Actually Irrigated Area
It corresponds to land within the limits of the irrigable area of equal or smaller size. The irrigated plots were generated in 3 stages: 1) digitization of polygons through visual interpretation of Google Earth® images, obtaining the agricultural parceling, 2) allocation of phenological data to each plot using NDVI temporal series and, 3) intersection of the digitized polygons layer with the irrigable area (A + B). (Figure 8).
Figure 8.Actually Irrigated area on the Cruz del Eje System.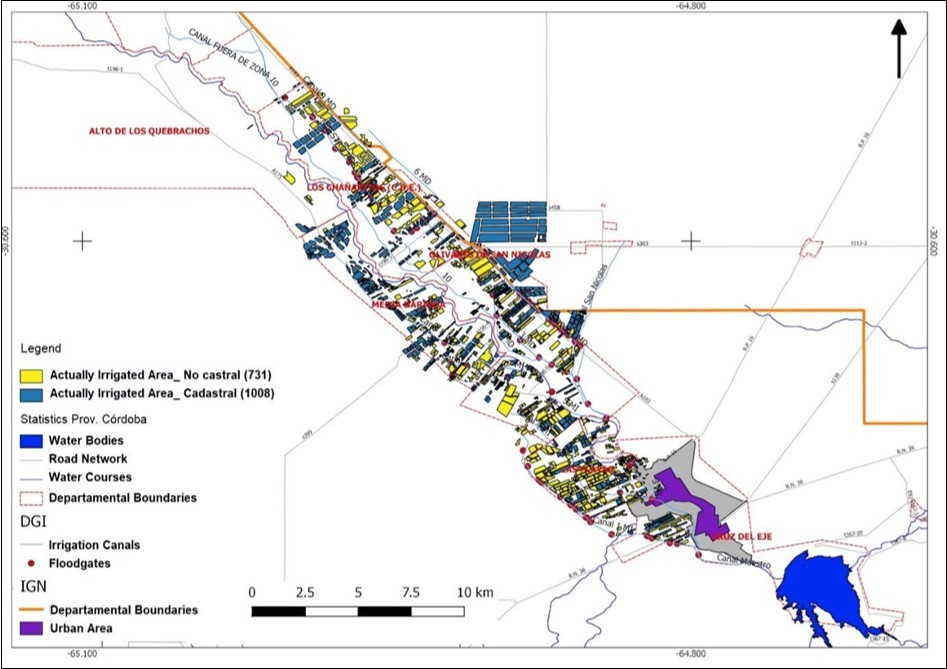
Through characterization, official data and remote sensing (indexes and digitizing of parcels), we obtained that the area really irrigated in Cruz del Eje system is approximately 4717.45 ha (Table 1). This represents a divergence of the method proposed by 1. This work advances on the contribution made by spatial information for irrigation detection. It is thought that the fusion of the cadastral data, with information from multitemporal analysis of NDVI assigned to the digitalized parcels (spatial segmentation) are useful for the identification of actually irrigated fields.
Table 1. Comparative Results of the Parcels Irrigable and Irrigated| Statistics | Irrigable Area | Irrigated Area | Irrigated AreaNot formally registered |
| Mean (Ha) | 38,82 | 2,66 | 2,79 |
| Median (Ha) | 8,72 | 1,11 | 1,48 |
| Minimum (Ha) | 0,06 | 0,05 | 0,061 |
| Maximum (Ha) | 1006,82 | 64,67 | 37,45 |
| N | 295 | 1008 | 731 |
| Total Area. (Ha) | 11.451,1 | 2685,45 | 2032 |
If we only follow the method proposed in 1, the estimate of area actually irrigated would be 40% less. The complementarity of GIS and remote sensing data is key to the required estimation. This figure is closer to the reality of the irrigated area, for which other approximation processes were carried out, such as classifications.
Land Use/Land Cover Classification
In Figure 9 we present a subset of the classified image using non supervised algorithms (ISODATA y K-Means) and supervised ones (SVM and RF), and in addition the real color image of the same subset. (Figure 9).
Figure 9.Zoom in images resulting from classification (K-Means, ISODATA, SVM and RF) and image in real color composition.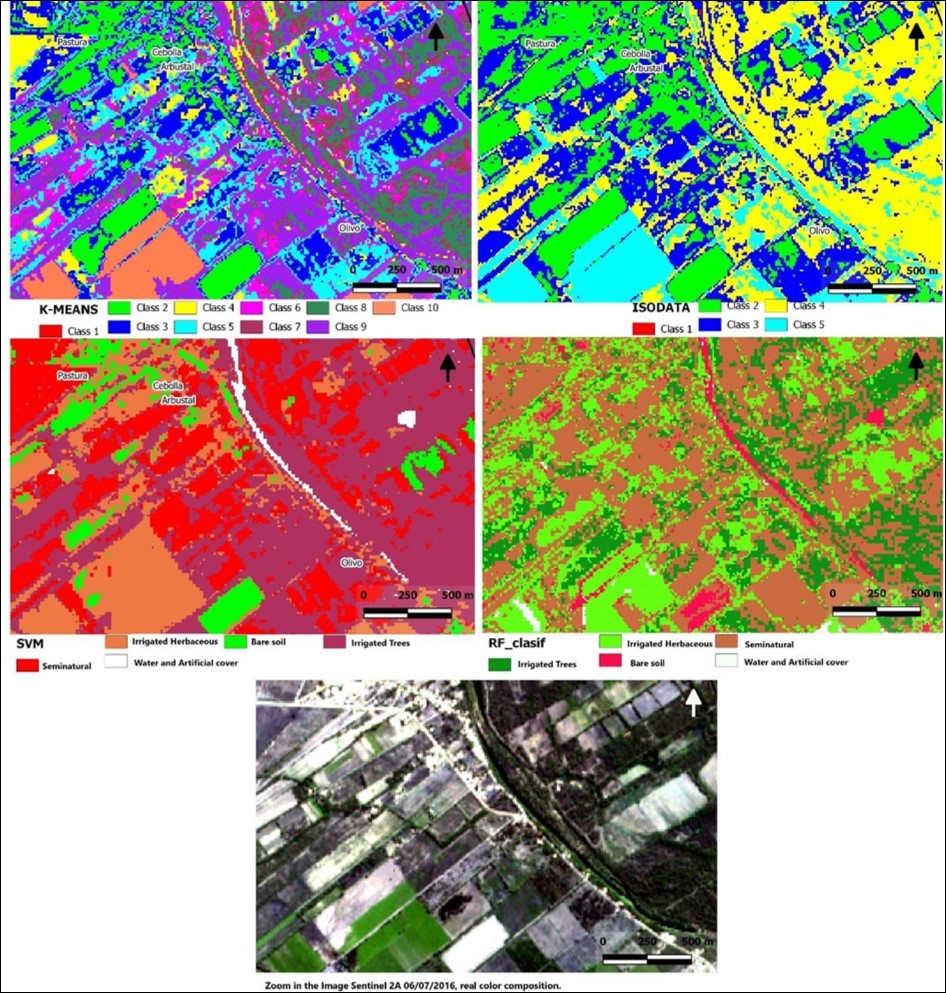
In the figure we can see how ISODATA and K-Means were able to detect different coverages within the plots. In the case of K-Means, it may be due to the greater number of classes, but for the ISODATA and SVM comparison, with the same number of classes, the first one is better. For a first approximation to the land cover, the classification with ISODATA was useful and allows us to define distinct classes.
The results from the confusion matrix of SVM seem promising and they represent an operational method to identify the amount of irrigated area, even with few field data. This result of global precision would improve if we increase the ground truth data; and thereby define other more specific interest classes. The final classification for the whole region obtained with RF is presented in Figure 10.
Figure 10.Random Forest Classification of Sentinel image on Irritation Region of Cruz del Eje System.
(Table 2) shows the values of the Kappa index and the overall accuracy (in percentage) obtained during the validation of supervised SVM and RF classifications.
The operational advantage of the SVM against RF (which showed better results) is something to be evaluated by the operator. If an algorithm is implemented as an R script in the QGIS environment, it can remedy the accessibility of this powerful classifier, while the processing cost is greater in RF compared to SVM.
Table 2. Validation Parameters of Supervised Classifications Svm Y RF| Overall Accuracy | Kappa-Coef | ||
| RF | 99,8 % | 0,96 | |
| SVM | 86,5 % | 0,81 |
Within the established irrigation region, the irrigated herbaceous (horticultural, alfalfa and winter green) area is 4,948.8 ha (Table 3). Another important area for the irrigation system are the Trees, that in this classification is built by fruit trees and water boundaries trees (those that are on canals, and in the river boundaries), this area is approximately 6,535.61 ha (Table 3).
Table 3. Areas of each class in the RF classification| Class/classification | RF Irrigation Region (ha) |
| Water and artificial cover | 433.8 |
| Irrigated Trees | 6,535.61 |
| Irrigated herbaceous | 4,948.8 |
| Seminatural | 6,575.34 |
| Bare soil | 1,036.4 |
| TOTAL | 19,529.95 |
Discussion and Conclusions
Using a characterization including the official datasheets and remote sensing we can present a simple approach with which we can say that the actually irrigated area in the Cruz del Eje System is approximately 4,717 ha in contrast with the 11,450 historically reported as irrigable area, and the 2,680 ha that is officially reported for year 2016 with the proposed method 1.
This study based in an enrichment of that methodology propose for INTA 1, the identification of the irrigated area from non-irrigated, is based on the spectral behavior of the result of irrigating the land, which is the green vegetation 30. The proposed methodology using basic image processing procedures validated the choice of dates for the seasonal and yearly characterization of the area. It also confirmed the efficiency of NDVI as a descriptive index of great utility in this type of studies for irrigated crops detection. Like the conclusions in 31 this work indicated that NDVI can provide robust field-specific and regional estimates of phenology and water use for horticultural crops with minimal requirement for supporting information.
The improvement offered by the manual segmentation 14 of plots to the identification of actually irrigated areas is promising and can be incorporated into this method automatically using plugins in QGIS, GRASS, R and other open source software.
The results of the surveying, characterization and mapping of irrigated and / or potentially irrigable areas can provide products that allow the elaboration of analysis maps referring to the current use of water for irrigation purposes as a descriptive memory and management tool.
This work demonstrates that even without all the institutional field database needed by the methods 1, it is possible to provide an estimation of actually irrigated area with free satellite imagery and processing, with a supervised classification of Sentinel 2, in open source programs.
The importance of this study is to increase the knowledge and propose a constant update of the amount of hectares irrigated. Ina system such as Cruz del Eje, which manages limited water flows and that, its inefficiency results in an environmental and economic cost that affects the sustainability of food production.
This method is easy to adopt, given that the processing tools and source data are freely available and we currently have products processed almost immediately upon acquisition. For example, Sentinel 2 is available for free as calibrated surface reflectance. The processing validated by this work sets precedents for a systematic follow-up of the amount of hectares with just one campaign of ground truth per field to be classified and a script that is available in GitHub for R 32 and that can be operationalized from the QGIS environment.
Different institutions, the General Directorate of Irrigation (DGI), the National Institute of Agricultural Technology (INTA); as well as the community management of water resources for irrigation, find in this methodology a response to their demands for information that is fundamental for water management and technical support.
Once the areas have been established according to the method proposed by 1, the area that must be updated at least annually is the "actually irrigated area". This paper provides a simple method, validated by data intercrossing, remote sensing and multitemporal analysis. RF is mainly characterized by its ability to estimate the importance of each predictive variable in the modeling of the response variable. Works such as Strobl et al. (2007, 2008) 29 found that the random forest package produces poor estimates in certain scenarios such as those analyzed here. The package RF provides a solution that uses conditional inference trees and estimates of importance, which makes it an attractive alternative to others.
Acknowledgements
In the first stage (GIS environment) the work was carried out funded by a Socio-Productive Technological Innovation Grant from the UNC, SECyT and SEU. Currently the advances are made with a PhD Scholarship cofounded INTA-CONICET. The work team included professionals from INTA AER CRUZ DEL EJE, PRET Norwest, DGI, UNC-SEU and SECYT. Especially we want to thanks the collaboration of the REGANTES CONSORTIUM, llaveros and farmers who collaborated in the description of the area and its problems.
References
- 1.INTA PNAGUA. (2014) Gestión del agua y el riego para el desarrollo sostenible de los territorios. [Online]. Available: http://aplicaciones.inta.gov.ar/buscador_proyectos/index.php/ver/programa_nacional#
- 2.Ministerio de Agroindustria. (2015) Estudio del potencial de ampliación del riego en Argentina. 123.
- 4.FAO. (2011) The state of the world's land and water resources for food and agriculture” (SOLAW)-Managing systems at risk. Food and Agriculture Organization of the United Nations, Rome and Earthscan. , London
- 5.de Proyecto. (2017) Desarrollo Institucional para la Inversión. Acuerdo UTF/ARG/017/ARG-MAGYP/FAO. Reporte Técnico. Buenos Aires. , Argentina
- 6.PROSAP. (2013) UTF/ ARG/017/ARG “Desarrollo Institucional para la Inversión”. “Estudio del Potencial de Ampliación de riego en Argentina”. Buenos Aires, Argentina. Reporte Técnico.
- 7.J Fernández Lozano. (2012) . La Producción de Hortalizas en Argentina Gerencia de Calidad y Tecnología,” Corporación del Merc. Cent. Buenos Aires 1-29.
- 9.García Campos. (2004) Eva María. Descripción actual de la infraestructura de riego. Descripción del Departamento de Cruz del Eje y de la zona de intervención.
- 10.J F Zamorano. (1981) Sistema de riego de Pichanas (Provincia de Córdoba). Estudio de prefactibilitad.
- 11.Méndez Plumed, Jorge. (2004) Análisis de la gestión de los recursos hídricos en la cuenca del río Pichanas.
- 13.Baojuan Z, W M Soe, S T Prasad, M A Rimjhim. (2015) A support vector machine to identify irrigated crop types using time-series 20 Landsat NDVI data. , International Journal of Applied Earth Observation and Geoinformation 34, 103-112.
- 14.Volante José N Campos, Cristian J Noé, Elena Yanina E y, Hernán J. (2007) Método de Clasificación “Por-parcela” para la Detección de Cultivos: Aplicación al Área Agrícola de Las Lajitas. Agrícola de Invierno 2006.” Congreso de la Asociación Española de Teledetección. Mar del Plata , (Salta, Argentina), Campaña .
- 15.Ming D, Luo J, Shen Z. (2005) Features Based Parcel Unit Extraction from High Resolution Image. 1875-1878.
- 16.Montesinos Salomón, Fernández Manuel Bea Y Lara. (2007) Estimación de la superficie en regadío mediante técnicas de teledetección: conceptos y su aplicación operativa.” Jornadas sobre las Aguas subterráneas en España ante las Directivas europeas: retos y perspectivas. Santiago de Compostela. , España
- 17.Volante J, Bianchi A, Paoli H, Noé Y, Elena H. (2005) Análisis de la Dinámica del Uso del Suelo Agrícola del Noroeste Argentino Mediante Teledetección y Sistemas de Información Geográfica. Período 2000-2005. Instituto Nacional de Tecnología Agropecuaria (INTA), Estación Experimental Agropecuaria Salta;. , Argentina
- 18.Yanina Elena NOE, Hernan Javier ELENA. (2014) . Fernando Martín LEDESMA Sistema de información geográfica con Qgis 2.x [Online]. Available: http://inta.gob.ar/documentos/sistema-de-informacion-geografica-con-qgis-2.x .
- 19.J R. (1974) Remote sensing of the environment: an earth resource perspective. Vegetation systems in the Great Plains with ERTS vol, 1-2000.
- 22.Nolasco M, Bocco M, Scavuzzo C. (2017) Mapeo de cultivos agrícolas en Córdoba: una comparación del desempeño de tres algoritmos de clasificación,”. 58-68.
- 23.R A Monserud, Leemans R. (1992) Comparing global vegetation maps with the Kappa statistic. , Ecol. Modell 62, 275-293.
- 24.Kuhn Max.(2016).Contributions from Jed Wing, Steve Weston,Andre Williams,Chris Keefer,Allan Engelhardt, Tony Cooper,Zachary Mayer, Brenton Kenkel, the R Core Team, Michael Benesty, Reynald Lescarbeau, Andrew Ziem,Luca Scrucca,Yuan Tang, Can Candan and Tyler Hunt, caret: Classification and Regression Training,R package version 6.0-72. https://CRAN.R-project.org/package=caret
- 25.R Core Team. (2013) R: A language and environment for statistical computing, R Foundation for Statistical Computing. , Vienna, Austria, URL http://www.R-project.org/
- 29.Strobl Carolin. (2008) Conditional variable importance for random forests. , BMC bioinformatics 9(1), 307.
- 30.T K Alexandridis, G C Zalidis, N G Silleos. (2008) Mapping irrigated area in Mediterranean basins using low cost satellite Earth Observation. computers and electronics in agriculture. 64(2), 93-103.