Efficacy of Commercial Symbiotic Bio-Fertilizer Consortium for Mitigating the Olive Quick Decline Syndrome (OQDS)
Abstract
The inoculation of soil with a bio-fertilizer (BF), with arbuscular mycorrhiza fungi, characterizes a Symbiotic (S) agriculture mode, aimed at promoting the yield and health of crops through modifications in the rhizosphere as well as in the plant phenotype. The main objective of this study was to reduce the incidence of Olive Quick Decline Syndrome (OQDS, involving Xylella fastidiosasubsp.pauca) that afflicts the olive groves in Apulia (Italy). Non-inoculated control (C) plants were compared with Symbiotic (S) plants inoculated with 20 kg ha-1 of Micosat F ®, through a 15 cm deep scarification, in the groves of seven farms covering an area of 27 ha. In addition to a visual observation of 484 plants, to obtain a gradation of the disease severity, some objective rapid type methods were utilized to survey the plants and soil , namely leaf pH, NIR tomoscopy of the leaves, hay-litter-bag probes coupled with NIR spectroscopy and the prediction of soil induced respiration. The fingerprinting of the S and C types of leaves and litter-bags was ascertained by means of the use of a random forest algorithm in the classification matrices. The results on the symptoms appeared variable: they were significantly mitigated in two groves out of six, but they were aggravated in one.
All the rapid measurements became essentials in a “holistic” model which was able to explain over 95% of the average mitigation / null / aggravation response to BF inoculation. The holistic model gathers differential and compositional analyses of the leaf (pH, crude protein, water) and of the soil (respiration), but depends mainly on the fingerprinting of the C and S leaves and litter-bags. Two keys were identified for a successful inoculation: a high degree of variability of the soil conditions permitting hospitality for the BF with enhancement of the microbial activity in the S soil (lowering the fingerprint of the control litter-bags) and homogeneity of the leaves (with increases in the fingerprint of the S leaves treated with BF). In short, the inoculation of diseased plants with one BF consortium is far from being the ultimate remedy to mitigate OQDS in all situations. Further studies are needed, at a field level, to clarify the soil hosting capacity and to define the mycorrhizal and / or endophytic * plant * pathogen interactions, even using rapid methods.
Author Contributions
Academic Editor: Abubaker Haroun Mohamed Adam, Department of Crop Science (Agronomy), College of Agriculture, Bahri University- Alkadaru- Khartoum -Sudan.
Checked for plagiarism: Yes
Review by: Single-blind
Copyright © 2019 Giusto Giovannetti, et al.
 This is an open-access article distributed under the terms of the Creative Commons Attribution License, which permits unrestricted use, distribution, and reproduction in any medium, provided the original author and source are credited.
Competing interests
The authors have declared that no competing interests exist.
Citation:
Introduction
Over the last decade, a plant desiccation epidemic, called CoDiRO (Olive Quick Decline Syndrome, OQDS), has developed in the olive groves of south Puglia (Italy)1,2. One of the main biological factors of this epidemic outbreak has been identified as Xylella fastidiosa subsp. pauca ST53 3,4,5, a disease that is universally known for having damaged orchards and plants in the Americas 6,7. The death of the olive plant follows a process that involves leaf scorching, followed by the death of secondary and primary branches 8, caused by a prolonged block in the sap flow in the xylem 9.
Scortichini et al. 10, after a three-year survey, obtained promising results that suggest that an integrated management, which includes regular pruning and soil harrowing, with spring and summer spray treatments with Dentamet® to reduce the severity of X. fastidiosa, may assist in the control of OQDS disease. However, their study scope did not cover the subspecies pauca that is active in Puglia.
Upon an attack by pathogens or insects, plants can "enlist" the help of protective microorganisms and increase their microbial activity to contrast pathogens 11. However, the delivery of a complex Bio-Fertilizer (BF), based on microbial consortia 12, can act by modifying the plant's physiology and lowering the in-vivo raw leaf pH, which is a concrete and easy endpoint to measure. Apart from accelerating the metabolism, BF acts on the induction of the genes of resistance present in plants, but which are not expressed without prior contact with pathogens. As a result of the inoculum, a consequent activation or suppression of otherwise silent genes is obtained, which recent studies on the genome of plants have identified as being closely related to contrast and alarm activities toward several phyto-pathologies. A demonstration of this was pertaing to the recovery of pears heavily affected by Erwinia amylovora fire blast13.
On the basis of the above considerations, the objectives of the present work were:
i) to revitalize the root microbiome of the infected plants thus reactivating the symbiotic interactions between the root system of the olive tree and the Arbuscular Mycorrhizae Fungi network;
ii) to strengthen the defense capabilities of the olive trees by increasing their resilience to the pathogen, through an activation of the latent gene pool; and
iii) to evaluate simple and accessible techniques to measure the health status of the olive trees as well as the biological status of the soil.
Experimental Procedure
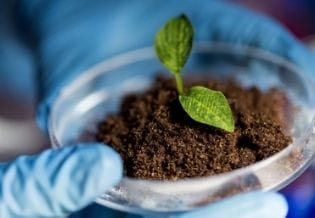
This study involved the use of a complex Bio-Fertilizer (BF), which has been defined as “symbiotic” because it contains arbuscular mycorrhizal fungi, spores and propagules, and other microbial species. The use of this BF also falls within the framework of precision agriculture, because the inoculum is distributed precisely in the proximity of the secondary roots of adult olive trees affected by OQDS.
After three months, treated Symbiotic (S) and non-inoculated Control (C) plants logged in seven farms were compared to establish their disease severity, by means of a visual appraisal coupled with rapid new tests, namely: litter-bags (differential and respiratory), foliar NIR scanning (differential and compositional) and foliar pH.
A final holistic elaboration gathered all the available results from the three main information tools, concerning the plant-soil-BF interactions, in a model that was there after used to explain a possible symbiotic mitigation process of the disease.
Material and Methods
Farms and Groves (Table 1)
Seven farms, located near Ugento (LE, Italy), provided access to their olive trees, which age ranged from fifteen to centenary, and were mainly from cv. Ogliarola di Lecce, although afew were also from cv.Leccino (Table 1).
Table 1. Characteristics of the Farms.| # | Farm | Surfaces, ha | |||
| C-Control | S-Symbiotic | Treatment date | Monitoring days after inoculation | ||
| 1 | A | 3.00 | 3.00 | 06-02-18 | 85 |
| 2 | B | 2.75 | 2.50 | 14-03-18 | 89 |
| 3 | C | 5.70 | 2.00 | 07-02-18 | 84 |
| 4 | D | 1.00 | 1.00 | 09-02-18 | 101 |
| 5 | E | 0.55 | 0.55 | 18-02-18 | 83 |
| 6 | F | 1.23 | 1.23 | 05-03-18 | 85 |
| 7 | G | 1.90 | 1.40 | 04-03-18 | 73 |
| 1 – 7 | A-G | 16.13 | 11.68 | 21-02-18 | 86 |
Bio-Fertilizer
A commercial symbiotic BF consortium (Micosat F ®, CCS-Aosta, Figure 1) was used at a dose of 20 kg ha-1. The root inoculation was a 15 cm deep scarification in which the microbial fertilizer was distributed. A furrow (Figure 1), which allows the surface roots of the plants to be inoculated, was made close to the trees. 1Micro Organisms (MOs) from finely ground cultivated Sorghum sudanensis roots, containing spores and hyphae of Funneliformis coronatus GO01 and GU53, F. caledonium GM24, F. intraradices GB67 and GG32, F. mosseae GP11 and GC11, F. viscosum GC41; saprotrophic fungi: Streptomyces spp. ST60, Streptomyces spp. SB14, Streptomyces spp. SA51, Beauveria spp. BB48, Trichoderma viride, Trichoderma harzianum TH01, Trichoderma atroviride TA28, Trichoderma spp.; rhizosphere bacteria: Bacillus subtilis BA41, Pseudomonas fluorescens PN53, Pseudomonas spp. PT65 and Pochonia chlamidosporia, in the relative percentage of 40% crude inoculum and 21.6% bacteria, and saprotrophic fungi.
Figure 1.Furrower coupled with a distributor of the granulated Micosat F ®1 under Ogliarola di Lecce olive trees.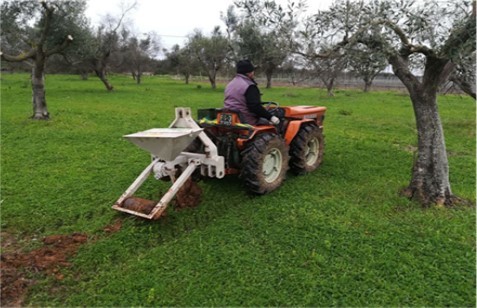
Morpho-Physio-Pathological Evaluation
About 18% of the inoculated trees were evaluated. The morpho-functional features were assessed considering six complex indicators.
1- Visual Evaluation
A four-point survey card was drawn up (Table 2)
Table 2. Sample plant survey form.| DSD-Disease SeverityDegree | QBS-Quantity of the Basal Suckers | RMB-Regrowth of the Main Branches | RSB-Regrowth of the Secondary Branches |
| 0-healty | 0-none | 0-none | 0-none |
| 1- One dry branch | 1-scarce | 1-short | 1-scarce |
| 2- two÷five dry branches | 2-low | 2-average | 2-normal |
| 3 => five dry branches | 3-normal | 3-long | 3-abundant |
| 4- plant almost dried | 4-abundant | ||
| 5- plant totally dry |
The codes were processed on the farms using Friedman’s unpaired tests (StatBox V6.5, Grimmersoft, Paris).
2- Foliar pH
According to the indications of previous works 12,14,15, the in vivo raw leaf pH measurements were carried out using a BORMAC pH-meter "XS pH 70" (www.giorgiobormac.com), range pH 0 ÷ 14, two decimals, supplied with a Hamilton Peek Double-PoreF, / Knick glass-plastic combination electrode, dimensions (LxØ) mm 35 × 6. The measurement was conducted on a packet of leaves pierced by a gimlet and a sensitive electrode was inserted into the thus obtained hole. Other types of electrodes were found to be unsuitable for this type of measurement. In order to understand the direction of the variations in the variables, it seemed appropriate to express the concentration of hydrogen ions [H +], or H = 10 ^ -pH * 10 ^ 6, rather than the potency (10) of H+ (pH). In this way, an increase in acidity - linked to the greater vigor of the plant - algebraically corresponds to an increase in [H+] and not to a decrease in pH.
3- Foliar NIRS and Discrimination
The NIR spectrum of the upper leaf blade was detected using a smart-NIR-SCÏOTM spectrometer (Consumer-Physics, Tel Aviv), which operates in the NIR 740-1070 nm band. The chemometric elaborations were carried out by means of the SCÏO-Lab software, which operates using AKA (As Known As) recognition matrices, built by means of a Random-Forest algorithm, and provides a percentage of recognition of the cells of the matrix (Table 3).
Table 3. Also Known As (AKA) classification matrix of the leaves obtained from Control plants (C) or treated with a symbiotic microbial consortium (S).| S predicted | CS% false positive | SS% |
| C predicted | CC% | SC% false negative |
| C measured | S measured |
4- Foliar NIRS and Composition
A series of leaf composition models were obtained from NIR-SCÏOTM foliar spectra, which had previously been obtained in a sorghum experiment 15. The equations were applied to the olive leaf spectra to obtain an estimate of several constituents. The predicted values were analysed by means of a bi-factorial GLM linear model (SAS 9.1).
5- Litter-Bags and NIRS for Discrimination.
As described in a recent paper 16, the litter-bag probes of ground hay (Figure 2) were buried close to secondary and superficial roots in a treated area (S- Symbiotic) or in an equivalent untreated area (C- Control). After being buried for about sixty days, the probes were removed from the ground, brushed and dried at a medium temperature (<60 °C). They were then examined by means of NIR-SCÏOTM. The chemometric elaborations were identical to those shown above for the leaves.
Figure 2.Hay litter-bags unearthed (bottom) and cleaned for NIR-SCÏOTM scanning (top)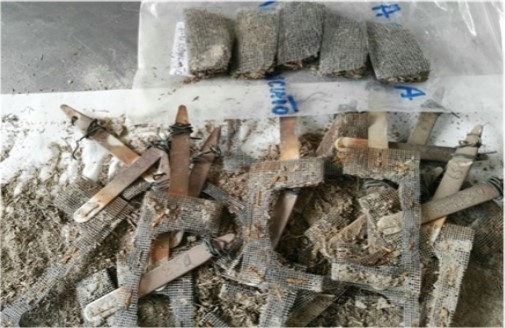
6 -Respiration Capacity of the Soil (R) (via Litter-Bags)
It was possible to have access to an NIR-SCÏOTM equation, taken from unpublished results of an experimental trial on tomato plants, that provides an indirect estimate of the respiration capacity of the soil (symbol R), measured according to Anderson and Domsch 17. After having added sugar to the soil sample, it was possible to measure the aerobic activity, induced by the microbial consortium, using the infrared meter. The correlation between the estimated and measured data resulted to be sufficiently high (R2cross-validated 0.86) to be considered reliable under comparable conditions.
A Holistic Model
The results from the bio-fertilizer treated (Symbiotic) and untreated (Control) plots of the farms were elaborated as effective size Ln(S/C) equivalent to (S/C)-1, expressed as a percentage, for the dependent vegetational variables observed in the plants, and for the independent variables measured within the holistic frame. The elaboration gathered the partial results from the main sources of information, namely the differential information from the fingerprints of the leaves and litter-bags, the compositional information from the leaves, and the respiration capacity of the soil. Since there were more variables than the paired groups, the only method available was the Partial Least Squares regression (PLS), provided by StatBox 6.5 (Grimmer Soft, Paris), in which two latent variables were utilized.
A restricted Litter-bag Model used to Forecast the Symbiotic Mitigation of the Disease
The average spectra of the litter-bags from the control plots in the seven groves were calibrated directly with the effective size Ln(S/C) of the plant response to the disease caused by the pathogen from the soil inoculation. For this purpose, the spectra imported into the WinISI II v1.04 chemometric software were math-treated as 2nd derivates (code SNV, 2,8,8,2), and the observed responses were then fitted to spectra using the modified partial least squares (MPLS) method, in which two latent variables were admitted, and the model was cross-validated.
Results
Plant Disease and Vegetation
Table 4 presents the results obtained from the monitoring of 484 plants on the seven farms, from which 379 determinations of the leaf pH, originating from 1516 leaf samples, were made with 3048 NIR-SCÏOTM spectra, while 380 NIR-scans were obtained from the litter-bags from the soil.
On the basis of the elaboration of the codes carried out on each farm, by means of the unpaired Friedman’s tests reported in Table 4, the degree of disease severity was significantly reduced in two cases: C (-40%) and D (-11%), while it became significantly worse in two others, namely G (+ 8%) and - especially- F (+ 164%), a farm where the great stoniness of the soil made it possible to only inoculate the part of the field that was most affected by the disease. The quantity of basal suckers decreased significantly following the treatment in two cases (C and F), while it increased abnormally (+ 278%) in the G groves. The regrowth of the main branches increased significantly in two cases (D and F) and almost significantly on farm A, while their presence was reduced by 43% on farm C. The regrowth of the secondary branches significantly decreased in two groves (C and G) and on average increased in B.
Table 4. Overall results of the visual evaluation of the fourteen C-Control and S-Symbiotic olive groves. Effect of the BF treatment calculated as d_Y/X = Ln(Y/X) expressed as a percentage (No.=484).| Groves | DSD-Disease Severity Degree | QBS-Quantity of the Basal Suckers | RMBRegrowth of the Main Branches | RSBRegrowth of the Secondary Branches | |||||||||
| C,S | d_S/C% | P | C,S | d_S/C% | P | C,S | d_S/C% | P | C,S | d_S/C% | P | ||
| A | C | 1.85 | 0.95 | 0.73 | 0.95 | ||||||||
| S | 1.79 | -3% | 0.55 | 0.93 | -2% | 0.95 | 0.95 | 30% | 0.09 | 1.03 | 8% | 0.43 | |
| B | C | 1.10 | 1.18 | 0.79 | 0.03 | ||||||||
| S | 1.10 | 0.0% | 0.81 | 1.00 | -15% | 0.37 | 0.64 | -19% | 0.23 | 0.10 | 233% | 0.17 | |
| C | C | 3.00 | 4.42 | 3.16 | 3.24 | ||||||||
| S | 1.79 | -40% | 0.0001 | 2.50 | - 43% | 0.0001 | 1.79 | -43% | 0.0001 | 1.18 | -64% | 0.0001 | |
| D | C | 3.38 | 1.46 | 0.62 | 0.77 | ||||||||
| S | 3.00 | -11% | 0.03 | 1.23 | -16% | 0.83 | 1.62 | 161% | 0.03 | 0.85 | 10% | 0.63 | |
| E | C | 1.86 | 1.00 | 0.62 | 1.00 | ||||||||
| S | 1.93 | 4% | 0.55 | 0.79 | -21% | 0.27 | 1.08 | 74% | 0.18 | 1.07 | 7% | 0.32 | |
| F1 | C | 1.30 | 3.22 | 1.22 | 0.91 | ||||||||
| S | 3.43 | 164% | 0.0001 | 1.22 | -62% | 0.0001 | 0.65 | -47% | 0.22 | 0.91 | 0% | 0.88 | |
| G | C | 2.78 | 0.09 | 1.66 | 0.81 | ||||||||
| S | 3.00 | 8% | 0.01 | 0.34 | 278% | 0.02 | 1.72 | 4% | 0.0006 | 0.16 | -80% | 0.02 | |
| Means | C | 2.18 | 1.76 | 1.26 | 1.10 | ||||||||
| S | 2.29 | 5.0% | 1.14 | -35.0% | 1.21 | -4.0% | 0.76 | -31% | |||||
Foliar NIRS– Fingerprint of the Symbiotic Treatment (S) and of the Control (C)
Overall (Table 5), the S leaves were recognized as S at 66% (P <0.0001), a significantly greater value than the 54% found in the controls, which, however, was still statistically significant as there were numerous samples. However, higher-level fingerprints appeared on individual farms, with an average 74% for SS and 66% for CC.
Table 5. Identification percentages (AKA matrices) of the C and S samples, based on the NIR-SCÏOTM scans of the leaves, for the total and individual samples on the seven farms (No. = 1516 C and S samples with 3048 spectra)1.| S | 46% | 66% |
| C | 54% | 34% |
| Total | C | S |
| Farms | CC | SS |
| A | 72% | 79% |
| B | 67% | 68% |
| C | 67% | 93% |
| D | 72% | 72% |
| E | 65% | 73% |
| F | 65% | 70% |
| G | 57% | 61% |
| Means | 66% | 74% |
Foliar NIRS- Changes in Spectra
A greater reflectance was observed for the leaves of the Symbiotic olive trees (Figure 3).
Figure 3.Leaf NIRS: average reflectance spectrum of the leaves collected in the Control sub-fields (C) and in the bio-fertilized (Symbiotic) sub-fields.
Foliar NIRS- Changes in Leaf Composition and Correlation with the Disease Severity Degree
In addition to a physical difference, a chemical variation also appeared in the leaves three months after the treatment. Their chemical composition resulted differentiated for all of the seventeen considered traits (Table 6), all of which showed significant Farm * MO interactions; however, when the symbiotic effect was considered, 7/17 of the variables responded to BF with an increase (water, ADF, non-digestible NDF, ADL, ether extract), while 5/17 responded with a decrease (cellulose, hemicellulose, total digestibility and crude protein). Among all the variables, the crude protein in the leaf emerged because of its high correlation (+0.90) with the variation in the disease severity degree (last column in Table 6), as clearly shown in Figure 4, where a positive relationships linked the two traits, which means that a decrease in the Ln(S/C) of protein favored a reduction in the disease.
Table 6. Overall NIRS-predicted composition of the leaves on the seven farms; the ANOVA results and numbers (#) of within-farm contrasts for the Symbiotic vs. Control, that is, positive for S (#S+), null (#=) or negative for S (#S-), ordered in decreasing #S+ and increasing #S-.| Constituents (X) | Overall Mean | R2 | CV% | Prob. of factors and interaction | Within-farm Contrasts (Y) | ||||||
| Farms | BF | Int. | #S+ | #= | #S- | r(X,DSD)1 | |||||
| Water | % | 70.38 | 0.08 | 3.8 | <.0001 | <.0001 | <.0001 | 4 | 2 | 1 | -0.33 |
| ADF | % | 46.48 | 0.07 | 2.2 | 0.0007 | <.0001 | <.0001 | 4 | 3 | 0 | -0.53 |
| Non-digestible NDF | % | 28.53 | 0.47 | 2.5 | <.0001 | <.0001 | <.0001 | 3 | 4 | 0 | -0.63 |
| ADL | % | 8.96 | 0.19 | 7.0 | <.0001 | 0.0012 | <.0001 | 3 | 2 | 2 | 0.59 |
| Ether extract | % | 1.38 | 0.13 | 3.6 | <.0001 | 0.0462 | <.0001 | 3 | 3 | 1 | 0.64 |
| Gross Energy | MJ/kg | 17.47 | 0.06 | 0.3 | <.0001 | 0.0788 | <.0001 | 2 | 4 | 1 | 0.70 |
| NDF | % | 47.76 | 0.35 | 2.5 | <.0001 | 0.099 | 0.0002 | 2 | 4 | 1 | -0.43 |
| Ash | % | 5.76 | 0.18 | 18.1 | <.0001 | 0.9723 | 0.0083 | 2 | 5 | 0 | -0.40 |
| NDF digestibility | % | 41.49 | 0.39 | 5.4 | <.0001 | 0.4967 | <.0001 | 2 | 3 | 2 | -0.69 |
| Crude fiber | % | 27.17 | 0.05 | 3.0 | <.0001 | 0.5533 | 0.0031 | 1 | 5 | 1 | 0.62 |
| Digestible NDF | % | 26.52 | 0.20 | 3.2 | <.0001 | 0.0979 | 0.0767 | 0 | 6 | 1 | -0.41 |
| Crop Maturity Index | N | 2.53 | 0.15 | 5.3 | <.0001 | 0.2893 | <.0001 | 0 | 6 | 1 | 0.52 |
| Crude Protein | % | 9.32 | 0.20 | 6.2 | <.0001 | 0.0166 | <.0001 | 0 | 6 | 1 | 0.90 |
| Total Digestibility | % | 71.43 | 0.37 | 0.7 | <.0001 | <.0001 | 0.0002 | 0 | 5 | 2 | 0.36 |
| Hemicellulose | % | 6.41 | 0.22 | 17.0 | <.0001 | <.0001 | 0.0002 | 0 | 4 | 3 | -0.39 |
| Free sugars | % | 44.54 | 0.09 | 3.2 | <.0001 | <.0001 | <.0001 | 0 | 4 | 3 | 0.25 |
| Cellulose | % | 24.19 | 0.14 | 5.3 | <.0001 | <.0001 | <.0001 | 2 | 1 | 4 | -0.61 |
Figure 4.Regression of the variation in the disease severity degree (Y=DSD d_S/C = Ln(S/C)) on the variation of the mean crude protein content of the leaf (X= CP d_S/C = Ln(S/C), excluding farm F).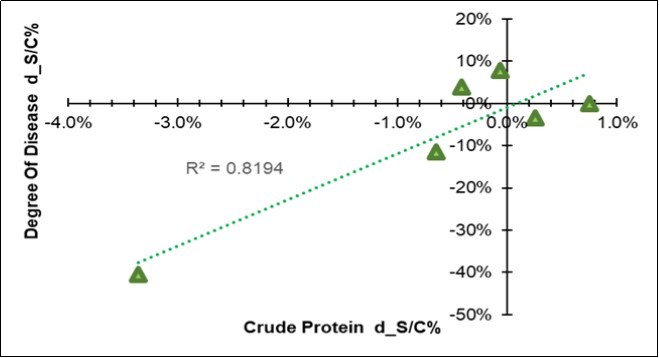
Foliar pH
The pH was only significantly modified by the BF treatment on farm A, where it increased by 1.2%. In two other cases, it increased by 0.6 - 0.7%, while it was on average acidified by 0.8% (Table 7) in four cases.
Table 7. Measurements of the foliar pH (No. 379), of the predicted constituents (No. 3048) and of the soil respiration capacity (No. 380).| Farms | BF | pH | Prob | H+ | Prob | Water% | Prob | Crude Protein% | Prob | Soil Respiration1 | Prob |
| LnS/C% | LnS/C% | LnS/C% | LnS/C% | LnS/C% | |||||||
| A | C | 5.29 | 0.02 | 5.1 | 0.02 | 70.3 | 0.1553 | 9.53 | 0.5159 | 196 | 0.88 |
| S | 5.35 | 1.2% | 4.4 | -14.0% | 70.2 | -0.1% | 9.55 | 0.3% | 194 | -1.0% | |
| B | C | 5.17 | 0.44 | 6.8 | 0.44 | 69.8 | <.0001 | 9.42 | 0.1848 | 157 | 0.06 |
| S | 5.2 | 0.6% | 6.4 | -7.0% | 70.4 | 0.8% | 9.49 | 0.7% | 139 | -11.3% | |
| C | C | 5.56 | 0.47 | 2.8 | 0.47 | 70.0 | <.0001 | 8.98 | <.0001 | 176 | 0.74 |
| S | 5.49 | -1.2% | 3.2 | 17.0% | 70.7 | 0.9% | 8.67 | -3.4% | 181 | 3.0% | |
| D | C | 5.3 | 0.78 | 5 | 0.78 | 70.8 | 0.9081 | 9.38 | 0.5108 | 184 | 0.48 |
| S | 5.28 | -0.4% | 5.2 | 5.0% | 70.8 | 0.0% | 9.32 | -0.7% | 172 | -6.4% | |
| E | C | 5.66 | 0.3 | 2.2 | 0.3 | 69.9 | 0.0393 | 9.45 | 0.6595 | 114 | 0.01 |
| S | 5.59 | -1.3% | 2.6 | 18.0% | 70.3 | 0.5% | 9.41 | -0.4% | 158 | 37.9% | |
| F | C | 5.4 | 0.5 | 4 | 0.5 | 70.8 | 0.0028 | 9.52 | 0.1074 | 183 | 0.66 |
| S | 5.43 | 0.7% | 3.7 | -8.0% | 70.4 | -0.6% | 9.40 | -1.2% | 178 | -2.8% | |
| G | C | 5.69 | 0.78 | 2.1 | 0.78 | 70.6 | 0.0012 | 9.30 | 0.9169 | 160 | 0.02 |
| S | 5.67 | -0.3% | 2.1 | 4.0% | 71.0 | 0.5% | 9.29 | -0.1% | 133 | -17.3% | |
| Means | C | 5.44 | 3.7 | 70.3 | 9.37 | 167.2 | |||||
| S | 5.43 | -0.1% | 3.7 | 1.0% | 70.5 | 0.3% | 9.31 | -0.7% | 164.9 | -1.3% |
Litter-bag- NIRS Fingerprinting of the Symbiotic Treatment (S) and of the Control (C)
The a priori percentage threshold was 50% for CC and for SS. It is shown, in Table 8, that the S symbiotic samples were recognized as S at 70% (P <0.0001), a significantly greater value than the 57% found in the C controls recognized as C, which is almost significant (P = 0.0569).
Table 8. AKA matrix of the C vs. S samples based on the NIR-SCÏOTM spectra of the litter-bags (N ° 380 spectra).| S | 43% | 70% |
| C | 57% | 30% |
| Total | C | S |
| Farms | CC | SS |
| A | 65% | 87% |
| B | 63% | 70% |
| C | 61% | 85% |
| D | 73% | 70% |
| E | 100% | 100% |
| F | 74% | 74% |
| G | 75% | 77% |
| Mean | 73% | 80% |
However, higher-levels appeared on individual farms , with an average fingerprint of 80% for SS and of 73% for CC.
NIR Spectra of the Litter-Bags
The average spectra of the two BF types are displayed in Figure 5. It appears that a greater reflectance of radiation distinguished the S litter-bags. The average S/C ratio increase is constant at around + 8% (Table 9). On the other hand, the standard deviation of the S spectra is reduced by 16%, compared with the corresponding C, and this is a sign of greater homogeneity. Figure 6 shows the two trends of the upper level and a minor dispersion pertaining the S spectra.
Figure 5.Average reflectance spectrum of the litter-bags in the sub-fields Control (C) and in the sub-fields Symbiotics, treated with Micosat (S).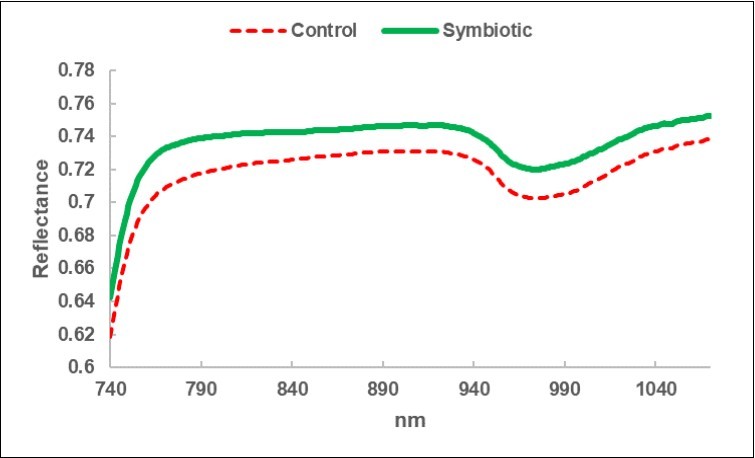
Figure 6.Frequency distribution of the reflectance spectra of the C and S litter-bags.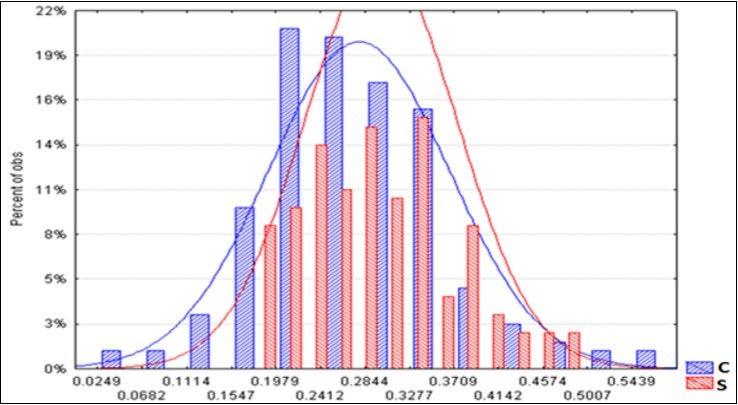
| BF | No. | Reflectance | Standard dev. |
| C | 185 | 0.277 | 0.087 |
| S | 195 | 0.298 | 0.074 |
| S / C % | + 8% | -16% | |
| Prob. | 0.0001 | ||
Respiration Capacity of the Soil (R) Estimated by Means of the NIRS of the Litter-Bags
The respiration capacity of the soil, as estimated by means of the NIRS of the litter-bags, increased significantly after the symbiotic treatment at the roots and in the soil on farm E (+ 38%), while it appeared somewhat decreased on G (-17%) and B (- 11%) (Table 7).
Useful Covariation: The High Fingerprinting of Symbiotic Leaves is Favorable for Reducing the Disease
A descending parabolic curve (Figure 7) shows that the disease decreased (favorable) when the fingerprint of the S leaves recognized as S was high, and vice versa.
Figure 7.Regression of the variation in the disease severity degree (DSD) (Y = d_S/C = Ln(S/C)) on the NIRS fingerprinting of the S-symbiotic olive leaves (X =fingerprint_SS).
Therefore, the symbiotic treatment increased the homogeneity of the leaf.
Useful Covariation: The Low Fingerprinting of the Control Litter-Bags is Favorable for Reducing the Disease
The litter-bag fingerprint appeared very different from the foliar NIRS fingerprint. In fact, an ascending parabolic trend is shown in Figure 8: when the disease decreased, the fingerprint of the Control litter-bags was lower. Vice versa, when the fingerprint of the Control litter-bags increased, the incidence of the disease increased. Therefore, the symbiotic treatment increased the heterogeneity of the litter-bags.
Figure 8.Regression of the degree of variation of the disease severity (Y, d_DSD) on the fingerprint value of the Control litter-bags (X, Litter-bags_CC).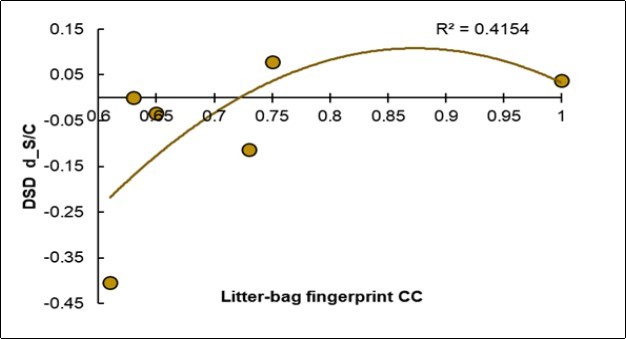
A Holistic Model to Explain the Symbiotic Mitigation of the Disease
All the variables provided in the study are summarized in Table 10. Excluding farm F, the remaining six are represented in a row in the table, in the form of the symbiotic effect d_S/C equivalent to Ln(S/C). The holistic PLS regressive model for the disease severity degree is reported in Table 11, and the scatterplots of the measured vs. predicted values are reported in Figure 9.
Table 10. Summary table of the dependent variables observed in the plants (Y) and the results of independent analytical determinations (X) of the foliar pH, foliar NIRS and litter-bags: values of the BF symbiotic effect d_S/C = Ln(S/C) in %.| Dependent Variablesobserved in the plants | Independent variables from the analyses X =d_S/C = LN(S/C) | |||||||||||
| Foliar NIRS fingerprint | LeafH+ | Litter-bagfingerprint | Soil Respiration (R) | Water | LeafProtein | |||||||
| d_DSD | d_QBS | d_RMB | d_RSB | F_CC | F_SS | d_S/C | L_CC | L_SS | d_S/C | d_S/C | d_S/C | |
| A | -3.4 | -2.6 | 31.0 | 7.9 | 72.0 | 79.0 | -14 | 65.0 | 87.0 | -1.0 | -0.1 | 0.3 |
| B | 0.0 | -15.2 | -19.4 | 300.0 | 67.0 | 68.0 | -7 | 63.0 | 70.0 | -11.3 | 0.8 | 0.7 |
| C | -40.4 | -43.5 | -43.3 | -63.4 | 67.0 | 93.0 | 16 | 61.0 | 85.0 | 3.0 | 0.9 | -3.4 |
| D | -11.4 | -15.8 | 162.5 | 10.0 | 72.0 | 72.0 | 5 | 73.0 | 70.0 | -6.4 | 0.0 | -0.7 |
| E | 3.8 | -21.4 | 75.0 | 7.1 | 65.0 | 73.0 | 16 | 100.0 | 100.0 | 37.9 | 0.5 | -0.4 |
| G | 7.9 | 266.7 | 3.8 | -80.8 | 57.0 | 61.0 | 5 | 75.0 | 77.0 | -17.3 | 0.5 | -0.1 |
| Ln(S/C) | DSD-Disease SeverityDegree | QBS-Quantity of theBasalSuckers | RMB-Regrowth of theMainBranches | RSB-Regrowth of theSecondaryBranches |
| d_H | -0.155 | 0.131 | 0.215 | -0.378 |
| d_R | -0.209 | -0.196 | 0.100 | -0.230 |
| F_SS | -0.301 | -0.720 | -0.087 | 0.030 |
| L_CC | 0.281 | -0.318 | 0.400 | -0.306 |
| Leaf water | -0.133 | 0.130 | -0.699 | 0.400 |
| Leaf crude protein | 0.350 | -0.184 | 0.010 | 0.346 |
| R2 | 0.96 | 0.48 | 0.72 | 0.59 |
| R2 cross-validated | 0.87 | 0 | 0 | 0 |
Figure 9.Linear regression scatterplot of the holistic model solutions for the symbiotic evolution of the disease severity degree (DSD).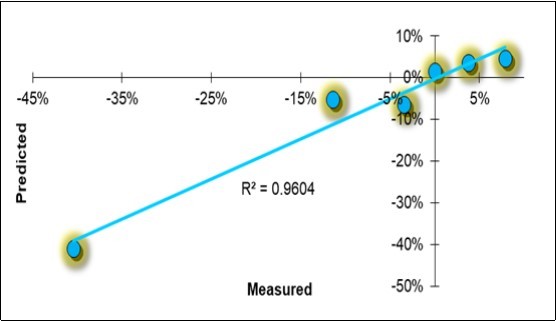
The mitigation effect on the disease appeared to be highly determined (R2 =0.96), and the model passed the cross-validation process, obtaining an R2 =0.87. There were six characteristic factors:
1) the acidity differential, with standardized factor d_H = -0.155, had a negative sign as the factors were opposite: symbiotic BF lowered the pH, raised the H+ and therefore reduced the disease;
2) the fingerprint of the CC litter-bags (L_CC = +0.281) had a positive sign: when the value was reduced, the pathological degree diminished, a sign that the BF had produced some effects;
3) the fingerprint of the SS leaves (F_SS= -0.301) had a high value and a negative sign: when the value was increased, the disease was reduced;
4) the soil respiration had a favorable negative sign (-0.209): when the respiration increased, the incidence of the disease decreased;
5) the water content of the leaves accounted for -0.133 units, which means that a greater quantity of water flowed and remained in the olive leaves during mitigation and recovery;
6) the crude protein accounted for +0.350 units, the highest contribution to the fitting.
The other dependent variables of the visual appraisal were less predictable. The standardized coefficients in Table 11 show a modest adaptation for the regrowth of the main (R2= 0.72) and secondary branches (0.59) and for the quantity of the basal suckers (0.48). However, none of these models passed the cross-classification.
A Restricted Litter-bag Model to Forecast the Symbiotic Mitigation of the Disease
The attempt to obtain a direct calibration of the average NIR spectra of the Control litter-bags from six farms was successful (Figure 10): the partial least squares reached an R2 in calibration of 0.945 (SEC 3.8%) and was stable in cross-validation mode (0.716; SECV 9.3%). The correlation (not shown) was non-uniform and showed seven nm ranges with higher resolution of the relationships.
Figure 10.Fitting of the symbiotic evolution of the disease severity degree (d_DSD) from the average NIR spectra of the Control litter-bags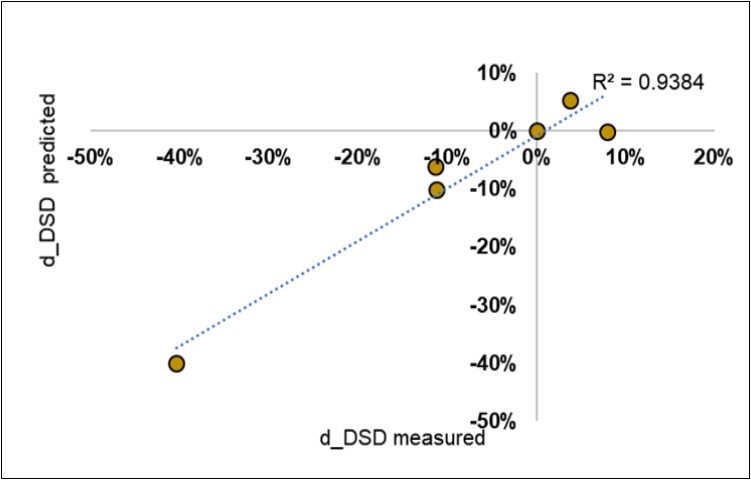
Discussion
The Soil
Overall, the soil biota played a key role by provide information and improved insights in this work. There are two environments in nature in which the highest known microbial densities are reached, that is, the human intestine 18and plant roots 11 (1 x 10¹³ and 1011per ml/g, respectively) 19. The inoculated BF appeared to influence in an almost paradoxical manner being in a very minor with respect to the microbial mass of the soil. According Fausto et al. 20, bacterial communities are more abundant than other communities in the soil of olive groves and reach the leaves through the xylem sap. They observed differences between a conventional and a more sustainable management system in the composition of soil bacterial communities. Hartman et al 21 also found that cropping practices can manipulate the abundance patterns of the root and soil microbiome species , and thus pave the way toward smart farming.
The response to symbiotic inoculation was first evaluated indirectly, considering the respiratory capacity of the soil in the control and in the inoculated modes; the results of the pairwise comparisons resulted in a negative sign (-0.209), in agreement with a favorable descent of the disease in the holistic model.
Among the agronomic measures of coexistence with X. fastidiosa, the working of the soilappeared beneficial 22,23. The soil in control plots have not been cut in the present work. Faced with this protocol anomaly, it was observed that, in the presence of disease 10, harrowing the soil of the control plants did not slow down the decline in the disease, and a Dentamet ® treatment was necessary to improve the survival of the trees.
The symbiotic treatment increased the homogeneity of the composition of the S litter-bags, as revealed by the higher fingerprint of the S type which were more prominent than the C types (70% vs. 57%). Therefore, the BF inoculum overall increased the functional homogeneity of the biota in the soil responsible for the litter-bag degradation. However, this soil-mechanism was unrelated to the mitigation of the disease, and this variable was in fact excluded from the holistic model. On the other hand, the fingerprinting of the control litter-bags recognized as the control ones was included in the holistic model with a positive sign (coeff. +0.281) and appeared as unfavourable for a reduction in the pathological intensity. Moreover, the observed parabolic trend means that when the percentage of fingerprinting CC was low, probably because of a numerical reduction and / or non-compliance of the MOs in the soil, the inoculation may have led to more favorable mitigation of the disease results: the first key for a successful inoculation has therefore been identified as a probably existing high degree of variability in the soil, which is favorable for welcoming the BF consortium. On the other hand, where a “strong” autochthonous biota or unfavorable settlement conditions oppose the acceptance of BF, a positive result is less probable and can also generate negative results, as on farm G.
The close relationships among the average NIR spectra of the litter-bags obtained without BF and the future results expected from a BF inoculation represents a possible extension for this quick method for a rapid soil fertility evaluation: a kind of “symbiometer”.
The Leaves
In the holistic model, the fingerprints of the Symbiotic leaves revealed a -0.301 value vs. the disease severity evolution, a sign that the MOs have had a maximum effect on both the leaves with higher fingerprinting, and on the plants, by reducing the symptoms. Instead, where the S leaves were fingerprinted less, the results were non-significant, and on one occasion were negative.
Previous research 10 showed that Dentamet® treated trees always had a mean NDVI index per tree greater than 0.60, with maximum relative peaks in parts of the tree canopies of 0.85, in both cv. Cellina di Nardò and cv.Ogliarola salentina trees; on the other hand, untreated trees, but still with vegetation, showed a mean NDVI index of 0.45. As far as the plant vigor in the present work is concerned, we did not use the visible red range, and the true indexes, such as NDVI and NDRE, are therefore not available for comparisons. However, the greater absorption by the leaves of the Symbiotic olive trees indicates a greater presence of substances capable of interacting with NIR radiation.
Accurate disease detection vs. healthy plant results have recently been obtained, by means of coordinated research on remote and local sensing 24, and these results have been confirmed by means of the quantitative polymerase chain reaction; when high-resolution fluorescence, quantified by three-dimensional simulations and thermal stress indicators, were coupled with photosynthetic traits sensitive to rapid pigment dynamics and degradation, 80% was exceeded. Moreover, it was found that trees that had visually been found asymptomatic, but then remotely labelled as diseased, later developed X. fastidiosa symptoms at almost double the rate of the asymptomatic trees that had been signalled as safe.
In the present work, we showed that several spectral plant-trait alterations in the foliar part of the plant (not the canopy) are linked to - or independent of – the mitigation or recruitment of the symptoms. The key mechanisms shown in the present work were reductions in leaf protein, cellulose and hemicellulose, which were balanced by an increase in ADF and lignin, together with an enhanced water content. Although the latter finding may be accounted for by considering a greater fluidity in the xylem vessels and / or increased osmotic pressure in the phloem, which may be attributable to pathogen inactivation, the other variations remain open questions. In the case of grapevines with Pierce’s diseases, symptomatic leaves developed lower water potentials than healthy plants around noon each day, which was related to a reduction in the osmotic potential of the leaf. The discovery that water stress was associated with X. fastidiosa, even though wilting had not been observed, provided significant clues to help understand the disease 25.
In this regard, a recent work 26has shown that ABA is not the key factor in controlling the stomatal closure of AM-inoculated olive plants under drought conditions. In fact, other AM-related factors are involved in the control of stomata regulation in mycorrhizal olive plants exposed to severe drought. These factors act specifically on the ‘Zarrazi’ drought-resistant cultivar, thereby permitting suitable stomata behaviour.
The reinforcement of cell wall parts during the mitigation processes can help protect the leaf from water exchanges. Moreover, along with the progression of disease severity 27, hydroxytyrosol glucoside disappeared (- 92%), while quinic acid increased more than three-fold, thus suggesting that changes in the levels of the two phenolic compounds could be reputed as markers of the bacterial infection in olive trees.
The protein reduction was in contrast with the expected effects of AM, as observed in a previous study with Sorghum15. Moreover, a test on AM inoculation in cv. Picholine marocaine olive plantlets28 showed that the leaf protein increased by about +21% under normal water conditions and by about +145% under severe water stress; in fact, in that case, the AM had responded to water stress with -24%, while the control plants registered -62%. A negative protein sign is generally indicative of a pathogenic attack: in greenhouse trials, leaf spot injury, caused by inoculation with various pathogens, reduced the crude protein content of infected alfalfa leaves by 22%, compared with a healthy control 29.
According to Lavee and Avidan 30, an alternate bearing of olive trees can modify the protein content in the leaves, in the sense of a lowering in the foliar protein in "off" trees compared to "on" trees. In our experiment, the attenuation of the foliar protein structures would seem to indicate a plant mitigating of the disease to one that starts to have a condition of limited production.
An increased concentration of expansins was observed in the vessels of the diseased plants 31. It is plausible to assume that, as a result of the synthesis of these proteins in the stem, the plant recycles leaf amino acids transferred by means of the phloem pathway.
Contrary to the general expectations about a pH decrease after BF inoculation, and reinforced by our early published result 12on healthy olive plants (-4% in BF inoculated symbiotic plants), the leaf pH here did not decrease, and in fact increased in one case. However, the general sense of the [H+] - complement of the pH - was negative (-0.155), thus in agreement in the holistic model with mitigation.
The rapid methods applied in this experiment do not make it possible to define whether the good results are due to an effective mycorrhization of the roots or to some positive microbial interaction in the rhizosphere with endophytic MOs, whose presence had been verified in the highly complex crude inoculum of the Micosat® containing 350 species of fungi and 1500 of other species 32.
Conclusions
Since X. fastidiosa subs. pauca damages the vessels and the leaves of plants, why should we pay attention to the roots of these plants? In this work, we have shown that an initial factor (like an original sin) can be found in the soil biota. Although we are unaware of the exact aetiology of such a favorable response to the inoculation of a small quantity of selected BF, we have described and tested a simple method - litter-bags – which are useful to evaluate the hospitality of a plant-soil complex to the foreign but beneficial BF.
Moreover, we have described and tested a set of rapid analyses to monitor the evolution of the disease, not by means of remote sensing, but through friendly contact with the plant and its soil environment. We are conscious that a model with six variables and only six pairwise issued from twelve data-sets cannot be anyway predictive. Thus the original methodological side of this research seems to be that of "learning \ teaching" on simple systems for monitoring the effectiveness of BF: we can anticipate that ongoing researches on various species (maize, tomato, potato) with the same model, are confirming these results in sign and amplitude of the vegetative response, that continues beyond the fruitfulness.
In substance, the inoculation of BF consortia is far from being a definitive remedy for OQDS, and it needs further investigations about the hosting capacity of the soil and concerning mycorrhizal and / or endophytic * plant * pathogen interactions, even using rapid methods (litter-bags, foliar pH, NIR tomoscopy) in field studies. However, some indications now exist on how to fight the disease with weapons that are to some extent more environment friendly and sustainable.
Acknowledgments
The research was supported by the “Regione Puglia” Bi.C.C. “Bio-Contrasto al CoDiRO” project.
References
- 1.Nigro F, Boscia D, Antelmi I, Ippolito A. (2013) Fungal species associated with a severe decline of olive. in southern Italy.J Plant Pathol95 668.
- 2.Martelli G P, Boscia D, Porcelli F, Saponari M. (2016) The olive quick decline syndrome in south-east Italy: a threatening phytosanitary emergency.European. , Journal of Plant Pathology144 235-43.
- 3.Saponari M, Loconsole G, Cornara D, Yokomi R K, A De Stradis et al. (2014) Infectivity and transmission ofXylella fastidiosabyPhilaenus spumarius (Hemiptera: Aphrophoridae). in Apulia, Italy.J Econ Entomol107 1316-9.
- 4.Saponari M, Boscia D, Nigro F, Martelli G P. (2013) Identification of DNA sequences related toXylella fastidiosain oleander, almond and olive trees exhibiting leaf scorch symptoms. in Apulia (southern Italy).J Plant Pathol95 659-68.
- 5.Cariddi C, Saponari M, Boscia D, A De Stradis, Loconsole G et al. (2014) Isolation of aXylella fastidiosastrain infecting olive and oleander in Apulia. , Italy.J Plant Pathol 96, 425-9.
- 6.RPP Almeida, Nunney L. (2015) How do plant diseases caused byXylella fastidiosaemerge?Plant. Dis99 1457-67.
- 7.Marcelletti S, Scortichini M. (2016) fastidiosaCoDiRO strain associated with the olive quick decline syndrome in southern Italy belongs to a clonal complex of thesubspecies paucathat evolved in Central. America.Microbiology162 2087-98.
- 8.Navarrete F, L De. (2014) Response ofXylella fastidiosato zinc: decreased culturability, increased exopolysaccharide production, and formation of resilient biofilms under fow conditions.Appl Environ. Microb80 1097-107.
- 9.LLR Marques, Ceri H, Manfo G P, Reid D M, Olson M E. (2000) Characterization of biofilm formation byXylella fastidiosain vitro.PlantDis86. 633-8.
- 10.Scortichini M, Jianchi C H, M De Caroli, Dalessandro G, Pucci N et al. (2018) A zinc, copper and citric acid biocomplex shows promise for control ofXylella fastidiosa subsp. paucain olive trees in Apulia region (southern Italy).Phytopathologia Mediterranea57. 48-72.
- 11.R L Berendsen, C M Pieterse, P A Bakker. (2012) The rhizosphere microbiome and plant health.Trends in plant science17. 478-486.
- 12.Masoero G, Cugnetto A. (2018) The raw pH in plants: a multifaceted parameter.Journal of Agronomy Research1. 18-34.
- 13.Verzelloni E, Catalano V, Giovanardi D, Dondini L, Stefani E. (2016) Uso di consorzi microbici nella lotta al Colpo di Fuoco batterico del pero.Informatore Agrario(28). 50-55.
- 14.Masoero G, Giovannetti G. (2015) vivoStem pH can testify the acidification of the maize treated by mycorrhizal and. microbial consortium.Journal of Environmental & Agricultural Sciences3 23-30.
- 15.Masoero G, P G, Cugnetto A, Giovannetti G. (2018) Raw pH fall-out as a sign of a mycorrhizal modifier ofSorghum sudanensis.Journal of Agronomy Research1. 1-11.
- 16.Masoero G, G Delmastro M Cugnetto A, Nuti M. (2018) NIRS footprint of bio-fertilizers from hay litter-bags.Journal of Agronomy Research1. 22-33.
- 17.Anderson J, Domsch K. (1978) A physiological method for the quantitative measurement of microbial biomass. in soils.Soil Biology and Biochemistry10 215-221.
- 18.Thursby E, Juge N. (2017) Introduction to the human gut microbiota.Biochemical. , Journal 474, 1823-36.
- 19.Hacquard S, Garrido-Oter R, González A, Spaepen S, Ackermann G et al. (2015) Microbiota and host nutrition across plant and animal kingdoms.Cell Host &. Microbe13; 603-16.
- 20.Fausto C, Mininni A N, Sofo A, Crecchio C, Scagliola M et al. (2019) Olive orchard microbiome: characterisation of bacterial communities in soil-plant compartments and their comparison between sustainable and conventional soil management systems.Plant Ecology & Diversity(accepted).
- 21.Hartman K, MG van der Heijden, Wittwer R A, Banerjee S, Walser J C et al. (2018) Cropping practices manipulate abundance patterns of root and soil microbiome members paving the way to smart farming.Microbiome6. 14.
- 22.Xiloyannis C, Sofo A, Mininni A N, Lardo E, Palese A M. (2016) The agro-ecosystemic benefits of sustainable management in an Italian olive grove. InVIII International Olive Symposium 303-308.
- 23.Xiloyannis C, Mininni A N, Lardo E, Miccoli A, Fausto C. (2017) Good agricultural practices in the management of the Olive Quick Decline Syndrome.Xylella fastidiosa& the Olive Quick Decline Syndrome (OQDS). , Séminaires Méditerranéens A 121, 83-85.
- 24.Zarco-Tejada P J, Camino C, Beck P S, Calderon R, Hornero A et al. (2018) Previsual symptoms ofXylella fastidiosainfection revealed in spectral plant-trait alterations.Nature. Plants4 432.
- 25.Goodwin P, Meredith C. (1988) New clues in understanding Pierce's disease.California. , Agriculture1 42, 6-7.
- 26.Ouledali S, Ennajeh M, Ferrandino A, Khemira H, Schubert A et al. (2019) Influence of arbuscular mycorrhizal fungi inoculation on the control of stomata functioning by abscisic acid (ABA) in drought-stressed olive plants.South. , African Journal of Botany121 152-8.
- 27.Luvisi A, Aprile A, Sabella E, Vergine M, Nicolì F et al. (2017) fastidiosa subsp. pauca(CoDiRO strain) infection in four olive (Olea europeaL.) cultivars: profile of phenolic compounds in leaves and progression of leaf scorch symptom.Phytopathologia. Mediterranea56 259-273.
- 28.Fouad M O, Essahibi A, Benhiba L, Qaddoury A. (2014) Effectiveness of arbuscular mycorrhizal fungi in the protection of olive plants against oxidative stress induced by drought.Spanish. , Journal of Agricultural Research12 763-71.
- 29.Hwang S F, Wang H, Gossen B D, Chang K F, Turnbull G D et al. (2006) Impact of foliar diseases on photosynthesis, protein content and seed yield of alfalfa and efficacy of fungicide application.European. , Journal of Plant Pathology115 389-99.
- 30.Lavee S, Avidan N. (1993) Protein content and composition of leaves and shoot bark in relation to alternate bearing of olive trees (Olea europaea L.). In II International Symposium on Olive Growing 143-147.
Cited by (20)
This article has been cited by 20 scholarly works according to:
Citing Articles:
Frontiers in Plant Science (2026) Crossref
World Journal of Microbiology and Biotechnology (2025) Crossref
Journal of Agronomy Research (2021) Crossref
Journal of Agronomy Research (2021) OpenAlex
Nutrients (2021) Crossref
Nutrients (2021) OpenAlex
S. Turroni, E. Petracci, V. Edefonti, A. Giudetti, F. D’Amico et al. - Nutrients (2021) Semantic Scholar
Journal of Agronomy Research (2021) Crossref
Journal of Agronomy Research (2021) OpenAlex
M. Nuti, G. Giovannetti, M. Scortichini, Giovanni Pergolese, M. Saracino et al. - (2021) Semantic Scholar
Journal of Agronomy Research (2020) Crossref
Journal of Agronomy Research (2020) OpenAlex
S. Volpato, G. Masoero, G. Giovannetti, M. Nuti - (2020) Semantic Scholar
Journal of Agronomy Research (2020) Crossref
Journal of Agronomy Research (2020) OpenAlex
E. Baldi, M. Toselli, G. Masoero, M. Nuti - (2020) Semantic Scholar
Journal of Agronomy Research (2020) Crossref
Journal of Agronomy Research (2020) OpenAlex
Sustainability (2020) Crossref
Sustainability (2020) OpenAlex
M. Scortichini - Sustainability (2020) Semantic Scholar
Journal of Agronomy Research (2020) Crossref
Journal of Agronomy Research (2020) OpenAlex
Journal of Agronomy Research (2019) OpenAlex
Journal of Agronomy Research (2019) Crossref