Abstract
There is currently a lack of rapid indirect analysis methods for the assessment of the effects of soil microbiota on vine production. Fifteen clusters of two Nebbiolo and Erbaluce varieties were identified in five vineyards belonging to a cooperative of winemakers in North West Italy, according to the differences in the NDVI index, as monitored by the Crop Monitoring OES system. The vineyards were surveyed in 2019 and the experimental monitoring of 75 vines was conducted in 2020. The first indirect method (Litterbag-NIRS) involved examining hay litterbags with a smart SCiOTM device. The average litterbag-NIR spectra of the clusters, as far as the yield is concerned, were closely fitted with the measured production yield, with an R2 cross-validated value of 0.91 in the Nebbiolo vines and 0.67 in the Erbaluce vines. The results in yield were accounted for by considering a few dominant variables in both vines, namely the microbic respiration of the soil and the crude protein of the litterbag (positive), opposed to the soil NO3--N and litterbag ADF (negative). The pruning wood was also closely correlated to the litterbag spectra. A second rapid method, foliar pH coupled with the NIR spectroscopy of the leaves, was then performed. The overall results predicted from the foliar NIRS were 0.73 for yield and 0.79 for the Canopy Cover. However, the most interesting result concerned the yield regressions on the foliar pH, which were clearly negative in both vines and of a similar amount: -5.15 kg/pH in Nebbiolo (R2 0.68) and -5.63 kg/pH (R2 0.23) in Erbaluce. Litterbag-NIRS, which shows a high predictive capacity, and foliar pH - with or without foliar-NIRS - are indirect and frugal methods that can be recommended for a rational assessment of the microbial soil fertility of vineyards.
Author Contributions
Academic Editor: Abubaker Haroun Mohamed Adam, Department of Crop Science (Agronomy), College of Agriculture, Bahri University- Alkadaru- Khartoum -Sudan.
Checked for plagiarism: Yes
Review by: Single-blind
Copyright © 2021 Alberto Cugnetto, et al.
 This is an open-access article distributed under the terms of the Creative Commons Attribution License, which permits unrestricted use, distribution, and reproduction in any medium, provided the original author and source are credited.
Competing interests
The authors have declared that no competing interests exist.
Citation:
Introduction
Clusters of different productivities are usually recognized in vineyards. Apart from microclimatic and border factors, which are more frequent in soils on slopes than in soils on plains, the variability within the same vine in fields may be attributable to different degrees of soil fertility. Such a soil variability, which is usually defined as the ability of a soil to promote plant growth and yield by integrating different soil functions1,including nutrient availability, microbial activity, and physical properties, is fundamental in determining the productivity of all farming systems. Consequently, the knowledge of the chemical and physical properties of a given soil is fundamental to reach a high standard production. However, information about the chemical fertility of a cultivated soil is useless if it is not combined with the knowledge of the microbial fertility. According to the official methods 2, 6 chemical measurements are required for a synthetic assessment of the biological fertility index on a scale of 1 to 5 (alarm, early warning, average, good, high): total organic carbon; basal respiration, cumulative breathing, microbial carbon, metabolic quotient and the quotient of mineralization. It is evident that a representative soil sampling of the production clusters dispersed in a vineyard cannot be carried out with conventional soil sampling and chemical analysis methods. Rapid analysis systems, envisaged for aspects of the foliage, lead to the formation of vigor maps, which are based on the normalized difference vegetation index. Satellite Sentinel-2 3 remote sensing is now routinely used to monitor crop vigor 4. Moreover, chemical parameters may be predicted directly in a field in a precision agriculture framework 5.
However, no easy indicator of the soil microbial status has been available until now. Increasing interest in microorganisms, such as endophytes, symbionts, pathogens, and plant growth promoting rhizobacteria, can be observed in the literature, while less attention has been paid to the larger community of soil microorganisms, or soil microbiome, which may have more far-reaching effects. Each organism in the community of soil microorganisms acts in coordination with the overall soil microbiome to influence the health of a plant and crop productivity 6.
The use of litterbags is a technique that has long been adopted in soil studies on the evolution of microfauna in bulk soil 7. However, there is still a lack of rapid measurement techniques that can be used to assess the microbial status of cultivated soils. The integrated use of NIRS and litterbag techniques could be a functional and rapid solution, as demonstrated by the fact that a change caused by a biofertilizer is reflected in the biochemical functioning mechanisms, and that such a change can be easily testified 8. The coupled use of these two techniques (intended as a quality evolution of litterbags swamps and not as mass decay), can be modeled as a valid fingerprinting of the studied field conditions, a process that results in data validation and predictive models. Furthermore, this combined technique could be used as a rapid and cost-efficient method, especially when compared with more complex - and as yet only experimental - methods, such as molecular metabarcoding, which is time consuming and expensive, as well as requiring a great deal of knowledge for the data analysis 10. After a two-year project based on maize field trials 11, it was concluded that just a few rapid NIRS analyses of litterbags and leaves, together with foliar pH measurements, are sufficient to explain over 87% of the variation in yield from biofertilized or non-biofertilized fields. The results of the application of Litterbag-NIRS were confirmed to be correlated with maize quality 12 and with potato yield biofertilization 13.
The aims of the present experiment have been to confirm the applicability of the Litterbag-NIRS and pH-Foliar-NIRS methods in domains with different clusters and to search for spectral correlations between plant yields and other phenotypes.
Experimental Procedure
A field monitoring of three clusters of different vigor, assessed in the summer of 2019, was conducted in the summer of 2020 in commercial vineyards with the aim of searching for sky-earth correlations to advance precision agriculture in vineyards. The Litterbag-NIRS method was applied, in parallel without soil chemical analyses, to correlate the yield of the identified production clusters. Moreover, by assessing a fingerprint in the electromagnetic spectra that was available from previous templates, it was possible to unravel some of the microbiological activities and soil traits that are in general favorable for the yield.
Material and Methods
Description and Management of the Sites
The trial was conducted in the western Po valley in three Erbaluce (CS, CS and EV) and two Nebbiolo (NG, NV) vineyards where three clusters had been identified, and five vines were observed in each cell (Table 1).
Table 1. List of grape related determinations.| Variables | Vineyard class | BBCH |
| Gems, n plant-1 | All | 5 |
| Inflorescences, n plant-1 | All | 57 |
| Fertility index, plant-1 | All | 57 |
| Canopy layers, n plant-1 | All | 79 |
| Berry weight, g | All | 89 |
| Yield, kg plant-1 | All | 89 |
| Pruning wood, kg plant-1 | All | 97 |
| Juice DM% (Brix°) | All | 89 |
| Juice pH | Nebbiolo | 89 |
| Leaf Area Index | Nebbiolo | 89 |
| Canopy cover Index | Nebbiolo | 89 |
| Clumping Index | Nebbiolo | 89 |
| Crown Porosity Index | Nebbiolo | 89 |
All the vineyards are on a hilly area of glacial morainic origin, with soils that show a tendentially acid / sub-acid reaction and an important presence of skeletons that greatly limit the workability of the soils. It is therefore normal to observe perennially grassed vineyards in this area.
The three Erbaluce vineyards were pruned following the traditional system, which involves pergola training with long and rich pruning, characterized by 2/3 fruit heads per plant and the same number renewal spurs in the following years. The CS and DS vineyards are located on a slope with South West exposure and have plant densities of 1.111 and 1.850 plants per hectare, respectively. Both are farmed organically with fertilization being carried out every two years with organic fertilizers based on poultry manure (N, P and K contents of 6 - 8 and 15 %, respectively) and with pest management based exclusively on copper and sulfur salts and mechanized grass management. The EV vineyard is flat and it is managed in a conventional way, with mineral fertilization based on 250 kg ha-1 of potassium and magnesium sulfate (K, Mg compositions of 30 and 10 %, respectively) spread in autumn 2019 and 166 kg ha-1 of organic/mineral fertilizer in spring 2020 (N, P, K compositions of 10 – 5 and 14,5 %, respectively). Moreover, an integrated pest and soil management, which includes three mechanical grass mulchings between the rows and two chemical weedings of eache row, is adopted during the vegetative period. The three vineyards are adults with vines of between 15 and 25 years.
The two Nebbiolo vineyards are pruned using the mono lateral guyot system with espalier training and a density of 3.460 plants per hectare. The NG vineyard is flat, with an average age of the vines of less than 10 years, while the NV vineyard is ion a steep slope and is West oriented; the plants are adult. In both cases, the vineyard management is conventional, following an integrated pest management protocol and had not been fertilized in the three years before the research. During the vegetative period, the soil management involves three grass mulchings between the rows and three mechanical processings under the rows.
A herbicide trial was performed in the conventional EV vineyard using a Glyphosate-based product.
The determinations were performed following the phenological growth stages and BBCH identification keys of grapevine (Table 1)14.
Canopy Architecture Determinations
In order to characterize the structure of the canopy of the plants under study, the leaf layers were determined using the “point quadrat” method 15. Some vigor and foliage density indices were also determined, albeit only for the Nebbiolo plots (Table 1), using an application developed by the University of Adelaide. “VitiCanopy” (https://www.plantransig.com/techniques/viticanopy/) is a free tool that growers, irrigation practitioners and scientists can use to quickly and reliably assess spatial and temporal growth and canopy architecture dynamics. This can then be associated with the final yield and grape quality. The app was released in September 2015, and was funded by the Australian Grape and Wine Authority.
This application, which can be used on an Iphone, was designed to obtain digital images of the canopy, which are then processed through a special algorithm that relates the full spaces of the wall to the empty ones. The application returns a series of indices that are closely related to the plant vigor 16. However, this app cannot be used for horizontal training systems (as for the pergola system) and for this reason the Erbaluce plants were excluded.
Berry Weight, Juice pH and Sugar Content Determination
A total of 100 berries were collected randomly from each plant during the harvest and subsequently taken to the laboratory.
A total of 20 berries were taken for each sample and were used to determine the average weight of the berries.
The grape sample was then manually pressed, filtered, and brought to a temperature of 20 °C. The degree brix and the pH were determined on the liquid fraction using a bench refractometer and pH meter.
Litterbag set up, Properties and Spectra Elaboration
On 20/05/2020, 5 litterbags per cell were buried at a depth of 5-10 cm. Each litterbag was filled with hay for small animals (“Vita Verde Small Animal Alpine Hay”, produced by Vitakraft pet care GmbH & Co. KG, Bremen, Germany), ground to 3 mm. About 2 g of hay was packed into half empty 5x10cm square polypropylene nets (1.5 mm mesh), which were resealed using 4 staples, and a plastic label was applied for identification and for easiness of finding purposes. The litterbags were explanted after 60 days, sun dried, gently cleaned and preserved at room temperature until delivery. The brushed litterbags were opened and the surfaces of both sides were examined, in reflectance mode, protected by a magnetic spacer capsule, measuring 9*40 mm, of a smart miniaturized NIRS web-based wireless spectrophotometer (SCiO v. 1.2, Consumer Physics, Tel Aviv, Israel) 17,operating in the 740-1070 nm range. Three spectra were scanned from each litterbag. The NIR spectra were downloaded from the SCiOTM repository, and then imported in WinISI II v1.04 (FOSS NIRSystem/Tecator, Infrasoft International, LLC) software compatible format. The spectra of each cluster were averaged, and the set was then subdivided into Erbaluce, with 8 clusters (the litterbags for one cluster of Erbaluce were missed) and Nebbiolo, with 6 clusters. The average yield results from each available cluster were then used separately to calibrate the average NIR SCiO spectra for the two vines, using the modified partial least square procedure; cross-validation was applied and elimination of the outliers was permitted with one passage, with threshold t =2. The original reflectance values (331 points) were used without any math pretreatment.
The chemical composition of the litterbag residues pertaining to each spectrum was predicted using templates assessed under WinISI format in an experiment on biofertilized tomato (9, Table 2). The predicted values were averaged per vineyard and cluster (14 cells) and a partial least squares analysis was then carried out on the averages to identify the variables with the maximum response – positive or negative – to yield variations. The XLStat 2019.4.1 (Addinsoft) package was used for this purpose.
Table 2. Foliar pH, yield and Sentinel-2-like reflectance of the leaf spectra in the vines, vineyards and clusters.| Vine | Vineyard | pH | Yield kg plant-1 | b6_750 nm | c7_793 nm | c8a_875 nm | d9_955 nm | ||||
| Erbaluce CS | 1 | 3.07 | cd | 5.12 * | bc | * | 0.612 | 0.664 | 0.681 | 0.675 | |
| Erbaluce CS | 1 | 3.29 | ab | 8.44 | ab | 0.590 | 0.647 | 0.659 | 0.649 | ||
| Erbaluce CS | 1 | 3.44 | a | 7.52 | ab | 0.613 | 0.669 | 0.681 | 0.668 | ||
| Erbaluce CD | 2 | 3.24 | b | 6.92 | ab | 0.621 | 0.684 | 0.700 | 0.693 | ||
| Erbaluce CD | 2 | 3.13 | bc | 9.68 | a | 0.625 | 0.691 | 0.709 | 0.703 | § | |
| Erbaluce CD | 2 | 3.38 | ab | 5.70 | ab | 0.576 | 0.626 | 0.635 | 0.625 | ||
| Erbaluce EV | 3 | 3.17 | bc | 7.40 | ab | 0.603 | 0.668 | 0.677 | 0.666 | ||
| Erbaluce EV | 3 | 3.23 | b | 6.82 | ab | 0.592 | 0.663 | 0.674 | 0.664 | ||
| Erbaluce EV | 3 | 3.16 | bc | 7.53 | ab | 0.589 | 0.662 | 0.671 | 0.657 | ||
| Nebbiolo NV | 4 | 3.08 | bc | 1.96 | c | 0.615 | 0.703 | 0.722 | 0.711 | ||
| Nebbiolo NV | 4 | 3.01 | cd | 5.70 * | ab | * | 0.638 | 0.721 | 0.737 | 0.722 | |
| Nebbiolo NV | 4 | 2.89 | d | 3.44 | c | 0.630 | 0.696 | 0.709 | 0.695 | ||
| Nebbiolo NG | 5 | 2.94 | d | 3.12 | c | 0.667 | 0.729 | 0.745 | 0.735 | ||
| Nebbiolo NG | 5 | 2.74 | e | 3.96 | c | 0.659 | 0.734 | 0.751 | 0.740 | ||
| Nebbiolo NG | 5 | 2.90 | d | 2.26 | c | 0.676 | 0.745 | 0.760 | 0.747 | ||
| Erbaluce | 3.23 | 7.24 | 0.602 | 0.664 | 0.676 | 0.667 | |||||
| Nebbiolo | 2.93 | 3.41 | 0.647 | 0.721 | 0.737 | 0.725 | |||||
| P(Vine) | <0.0001 | <0.0001 | <0.0001 | <0.0001 | <0.0001 | <0.0001 | |||||
| RMSE | 0.22 | 2.95 | 0.043 | 0.048 | 0.050 | 0.048 | |||||
| R2model | 0.42 | 0.42 | 0.21 | 0.26 | 0.27 | 0.26 |
Foliar Measurements and Analyses
On June 20, samples of 10 leaves, randomly chosen from each cluster, were analyzed for petiole pH using a Hamilton Peek Double-Pore F, / Knick combined 35 x 6 (LxØ) glass-plastic electrode, two decimals, and an NIR-SCiOTM smart device, as described in Masoero et al.18, with two replicates for each leaf. The foliar pH data were analyzed, according to a bifactorial linear model, with vine and vineyards within vine as the fixed effects. Moreover, since the pH value of each leaf was known, a calibration of the single spectra was attempted. As explained above for the litterbags, the composition of the fresh vine leaves was predicted from NIR spectra using PLS models derived from an experiment with mycorrhizae in Sorghumsudanensis19and in a study on the green pruning residues of grapevine 20. The predicted average values were elaborated in the same way as before for the litterbags to establish which properties were connected the most with the realized yield. The information from the foliar spectra was synthesized in four bands, equivalent to those available from the Sentinel-2 satellite remote sensing services, namely b6(750nm), c7(793nm), c8a(875nm) and d9(955nm).
Herbicide fingerprinting in Litterbag-NIRS.
Chemometrics of the 331-point NIR spectra was performed using the SCiOTM Lab proprietary software, by means of a classification procedure based on a random forest algorithm. The reflectance spectra were mathematically transformed as standard normal variates, Log and 1st derivate, and the classification then produced an AKA (as known as) confusion matrix on the basis of belonging to a Herbicide or Not-herbicide class within one of the Erbaluce vineyards. The calibration model assessed in that vineyard was then validated in the other two all-organic Non-herbicide Erbaluce vineyards and two similar organic Nebbiolo vineyards. The probability vs. threshold of 50% was tested using the online version of Med-Calc for percentage comparisons.
Results
Yield and foliar pH
As expected , Erbaluce produced 112% more than Nebbiolo, but the foliar pH was unusually 10% higher (3.23 vs. 2.93), which, however, is a large amount.
Means with different letters are different at P <0.05; * Two outliers found for the within-vine group linear regression of the yield on pH (Figure 1); § one outlier found for the PLS regression of the yield on the Sentinel-2-like bands
Figure 1.Regression of the yield on the foliar pH in the Erbaluce and Nebbiolo vines, excluded two overlapping points.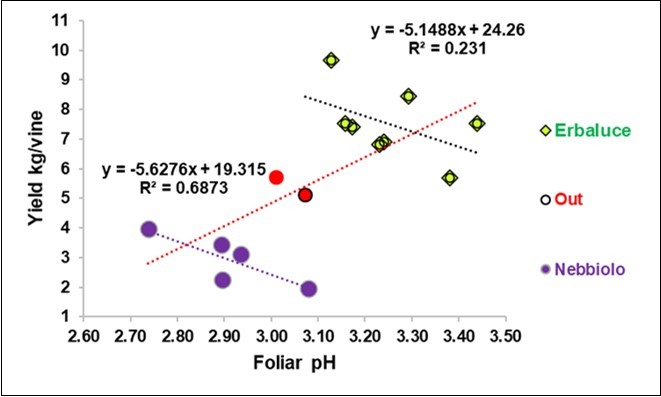
The yield and foliar pH were correlated, but the trends were different for the between or within vine regressions. In fact, when considering all 15 cells (Figure 1), the general regression of the yield on foliar pH was positive (red line), but after excluding two intermediate cells (Table 1), the within vine regressions were clearly negative and of a similar amount (-5.15 kg/pH in Erbaluce and – 5.63 kg/pH in Nebbiolo).
NIR Spectra of the Leaves and Correlation with the Yield and other Traits.
The Nebbiolo leaves were 8.7% more reflective than the Erbaluce ones (Figure 2).
Figure 2.Average reflectance spectra of the Erbaluce and Nebbiolo leaves. The arrows indicate the four Sentinel-2 like bands b6 (750nm), c7 (793nm), c8a (875nm) and d9 (955nm).
The prediction of the yield from the single foliar NIR spectra, by means of the PLS model, reached an R-square cross-validated (R2cv) value of 0.66 for the overall cases (Table 2), with a closer fitting for Erbaluce than for Nebbiolo (Figure 3).
Figure 3.Biplot of the average measured yield (X) vs. the average yield predicted with NIR-SCiOTM from the leaves using the spectra of 13 groups (2 excluded).
Several other traits were positively correlated with the foliar NIR spectra (Table 3), inprimis, the Leaf Area Index (0.85), the Canopy cover (0.93), the clumping index (0.66) and the crown porosity (0.84) for Nebbiolo. Some vegetational traits were also positively correlated concerning the gems (0.64 in all for Nebbiolo), inflorescences (0.67 in all) and fertility for Erbaluce (0.68).
Table 3. PLS Calibration and cross validation of the single foliar NIR spectra on several variables.| Class | Variables | N | Mean | SD | SECV | R2cv |
| All | Yield, kg plant-1 | 277 | 5.76 | 2.13 | 1.44 | 0.66 |
| Erbaluce | 104 | 3.83 | 4.25 | 2.41 | 0.68 | |
| Nebbiolo | 164 | 2.44 | 3.84 | 2.45 | 0.59 | |
| Nebbiolo | Leaf Area Index, n | 116 | 1.73 | 0.49 | 0.19 | 0.85 |
| Nebbiolo | Canopy cover, , | 111 | 0.75 | 0.12 | 0.03 | 0.93 |
| Nebbiolo | Clumping Index | 113 | 0.21 | 0.05 | 0.03 | 0.66 |
| Nebbiolo | Crown Porosity | 112 | 0.79 | 0.06 | 0.02 | 0.84 |
| All | Leaf layers, n plant-1 | 278 | 2.72 | 0.40 | 0.30 | 0.43 |
| Erbaluce | 107 | 3.04 | 0.30 | 0.15 | 0.73 | |
| Nebbiolo | 163 | 2.50 | 0.30 | 0.28 | 0.16 | |
| All | Gems, n plant-1 | 277 | 33.65 | 17.71 | 10.54 | 0.64 |
| Erbaluce | 114 | 49.43 | 7.03 | 6.22 | 0.21 | |
| Nebbiolo | 164 | 22.46 | 14.79 | 8.82 | 0.64 | |
| All | Inflorescences, n plant-1 | 277 | 24.54 | 14.36 | 8.28 | 0.67 |
| Erbaluce | 114 | 38.05 | 5.78 | 5.70 | 0.02 | |
| Nebbiolo | 161 | 12.96 | 8.87 | 6.20 | 0.51 | |
| All | Fertility, n plant-1 | 229 | 0.77 | 0.15 | 0.11 | 0.46 |
| Erbaluce | 103 | 0.31 | 0.35 | 0.20 | 0.68 | |
| Nebbiolo | 167 | 0.80 | 0.15 | 0.12 | 0.35 | |
| All | Average grape weight, g | 279 | 2.28 | 0.31 | 0.23 | 0.45 |
| Erbaluce | 105 | 2.46 | 0.18 | 0.17 | 0.03 | |
| Nebbiolo | 171 | 2.12 | 0.31 | 0.21 | 0.52 | |
| All | Grape Brix° | 273 | 21.86 | 1.45 | 1.37 | 0.10 |
| Erbaluce | 104 | 21.10 | 0.79 | 0.54 | 0.52 | |
| Nebbiolo | 164 | 22.16 | 1.88 | 1.87 | 0.01 | |
| All | Grape pH | 254 | 3.10 | 0.05 | 0.04 | 0.39 |
| Erbaluce | 105 | 3.08 | 0.03 | 0.02 | 0.46 | |
| Nebbiolo | 178 | 2.98 | 0.26 | 0.25 | 0.06 |
Yield Prediction from Sentinel-2 – Like Reflectance and Foliar pH
The spectral information of the leaves, as available in the four Sentinel-2-like bands, or implemented in the PLS models with the foliar pH, is presented in Table 4 for all the vines together and separately. Considering all the vines, the models were able to attain an R2cv value of 0.77 using the five predictors and 0.73 with only the Sentinel-2 variables (Table 4, Figure 4).
Table 4. PLS Calibration and cross validation of four Sentinel-2 reflections (4Sent2) and considering the foliar pH (pH) on the Yield in all the vines or separately.| Variables | N | Mean | SD | SECV | R2cv | |
| All | 4Sent2 +pH | 12 | 5.68 | 2.08 | 1.02 | 0.77 |
| All | 4Sent2 | 12 | 5.68 | 2.08 | 1.10 | 0.73 |
| Erbaluce | 4Sent2 +pH | 8 | 6.93 | 1.12 | 1.84 | 0.00 |
| Erbaluce | 4Sent2 | 7 | 7.19 | 0.91 | 1.48 | 0.00 |
| Nebbiolo | 4Sent2 +pH | 5 | 2.95 | 0.83 | 0.67 | 0.47 |
| Nebbiolo | 4Sent2 | 6 | 3.41 | 1.35 | 1.89 | 0.00 |
Figure 4.Biplot of the measured (X) vs. predicted yield from the PLS model with four Sentinel 2 -like reflectances and the foliar pH using the averages of 12 groups (3 excluded).
Litterbag-NIRS
The prediction of yield from the Litterbag-NIR spectra, through the PLS model, reached an R-square cross-validated (R2cv) value of 0.72 for the overall cases (Table 5), albeit with a lower fitting for Erbaluce (0.67, Figure 5) than for Nebbiolo (0.91; Figure 6).
Table 5. PLS Calibration and cross validation of the Litterbag-NIRS spectra averaged by groups on several variables measured in fifteen vines per group.| Variables | N | Mean | SD | SECV | R2cv | |
| All | Yield, kg plant-1 | 12 | 5.41 | 2.17 | 1.19 | 0.72 |
| Erbaluce | 7 | 6.84 | 1.18 | 0.73 | 0.67 | |
| Nebbiolo | 6 | 3.41 | 1.35 | 0.44 | 0.91 | |
| All | Wood, kg plant-1 | 11 | 1.77 | 0.50 | 0.21 | 0.83 |
| Nebbiolo | Leaf Area Index, n | 5 | 1.86 | 0.47 | 0.39 | 0.43 |
| Nebbiolo | Canopy cover, | 5 | 0.78 | 0.13 | 0.08 | 0.72 |
| All | Gems, n plant-1 | 13 | 33.06 | 18.04 | 11.71 | 0.57 |
| Erbaluce | 6 | 43.30 | 3.14 | 4.22 | 0.00 | |
| Nebbiolo | 5 | 12.08 | 1.75 | 0.52 | 0.93 | |
| All | Gems, n head-to-fruit-1 | 13 | 29.37 | 16.57 | 10.69 | 0.57 |
| Erbaluce | 8 | 41.55 | 5.39 | 6.28 | 0.00 | |
| Nebbiolo | 5 | 10.08 | 1.36 | 0.72 | 0.77 | |
| All | Gems, n plant-1 | 13 | 34.57 | 18.20 | 11.16 | 0.62 |
| Erbaluce | 7 | 46.54 | 6.10 | 7.00 | 0.00 | |
| Nebbiolo | 6 | 13.73 | 2.88 | 3.47 | 0.00 | |
| All | Gems, n plant-1 | 13 | 23.85 | 14.66 | 9.63 | 0.58 |
| Erbaluce | 7 | 32.43 | 7.31 | 4.41 | 0.69 | |
| Nebbiolo | 6 | 8.00 | 2.13 | 1.51 | 0.58 | |
| All | Inflorescences, n head-to-fruit-1 | 13 | 24.12 | 15.25 | 10.27 | 0.55 |
| Erbaluce | 7 | 33.77 | 8.59 | 5.52 | 0.65 | |
| Nebbiolo | 6 | 7.60 | 1.73 | 1.82 | 0.07 | |
| All | Grape Brix | 11 | 21.91 | 1.29 | 0.92 | 0.53 |
| Erbaluce | 7 | 21.28 | 1.01 | 0.98 | 0.19 | |
| Nebbiolo | 5 | 23.20 | 0.96 | 0.67 | 0.61 | |
| All | Grape pH | 11 | 3.08 | 0.05 | 0.03 | 0.56 |
| Erbaluce | 7 | 3.08 | 0.04 | 0.05 | 0.00 | |
| Nebbiolo | 5 | 3.12 | 0.08 | 0.02 | 0.97 |
Figure 5.Biplot of the measured (X) vs. predicted yield from Litterbag-NIRS for the Erbaluce vines.
Figure 6.Biplot of the measured (X) vs. predicted yield from Litterbag-NIRS for the Nebbiolo vines.
The pruning wood was also closely correlated to the litterbag spectra (Table 4, Figure 7), with R2cv 0.83.
Figure 7.Biplot of the measured (X) vs. predicted pruning wood from Litterbag-NIRS (three outliers in red).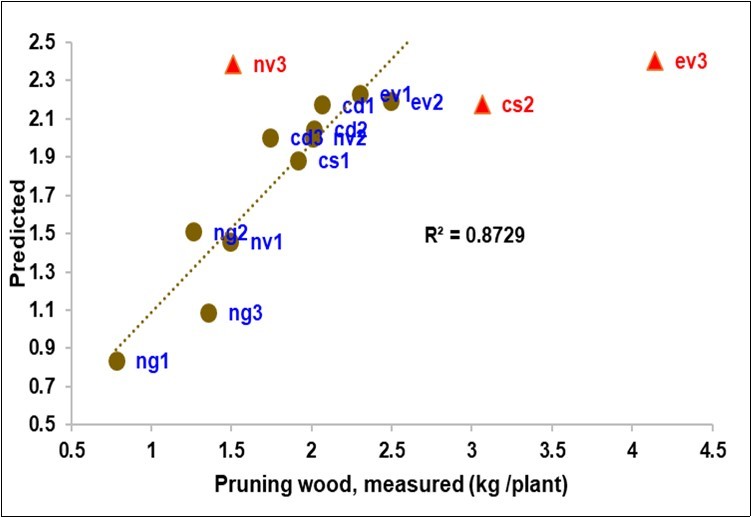
Some positive relationships emerged for the vegetational and fruiting characteristics of Erbaluce, for the leaf layer (0.94) and inflorescences (0.65), especially for the Nebbiolo vine, and for the canopy cover (0.72), the crown porosity (0.65) and the gems (0.93 and 0.77), especially for the pH of the grape (0.91), but less for the Brix (0.61).
Prominent Litterbag-NIRS Variables on Yield
Among the 20 variables predicted by means of the litterbag-NIRS method described in a previous paper 9, only a few (four) were clearly responsible for the yield variation (Table 6), and the same four variables emerged for both vines. The favorable correlation with yield depended above all on the soil Substrate Induced Respiration (SIR) expression of the C microbic, and then on the protein residual in the litterbags. On the other hand, the yield was favored when the litterbags showed low amounts of Acid Detergent Fiber (ADF) and the soil showed a lower presence of NO3--N.
Table 6. The prominent litterbag and soil variables on the Yield.| Yield related | Erbaluce | Nebbiolo | Erbaluce | Nebbiolo |
| Variable | PLS Std Coefficient | Mean ± Std | ||
| SIR- Substrate Induced RespirationSoil C microbic, µg Cmic g-1 FW | 0.145 | 0.060 | 93.8 ± 8.7 | 84.4 ± 8.07 |
| Litterbag Crude protein, %DM | 0.010 | 0.009 | 12.9 ± 0.8 | 10.8 ± 2.1 |
| Litterbag ADF, %DM | -0.033 | -0.023 | 25.9 ± 1.9 | 30.6 ± 5.8 |
| Soil NO3--N, mg kg-1 DM | -0.129 | -0.022 | 22.4 ± 4.2 | 14.6 ± 3.9 |
Principal component Analysis
The variables of the decomposing hay and of the soil, as predicted by the Litterbag-NIRS method, adopting the templates presented in Baldi et al.9 , are shown in Figure 6, together with the subjects of the study, namely the five vineyards with either three or two clusters. The first principal component separates the young Nebbiolo (ng) from the Erbaluce (cs, cd, ev) and old Nebbiolo (nv). The second principal component instead divides the rapid variables, that is, those that decrease in percentage over time and which are colored in red and placed mainly above the horizontal axis, from the resistant variables, that is, those that increase in percentage over time, which are colored in black and placed below the horizontal axis. The rapid r-strategist microorganisms in the scheme of Figure 8 are in the upper part, while the slower k-strategists are in the lower part.
Figure 8.Plot of the principal component analysis of the vineyards with the litterbag and soil variables
The variables linked to a more intense Mycorrizhal status (Myc-type) are associated with the young Nebbiolo, while the yield is obviously oriented in the Erbaluce clusters.
Fingerprinting of the Herbicide in Litterbag-NIRS
A relevant spectral signature of the weed treatment appeared in the Litterbag-NIRS spectra for the Erbaluce vineyard (Table 7), with a classification of 94% for the fingerprinting of the litterbag derived soils without Herbicide, but 62% (not significant) for the litterbags derived from soil with Herbicide.
Table 7. Fingerprinting of the Herbicide\Non-herbicide treatment in the litterbags. Calibration and validation performances.| Vine | Vineyard | No. | %F(Non) | P(Non) | %F(Herb) | P(Herb) | |
| Calibration | Erbaluce | EV | 80 | 94% | 0.0001 | 62% | 0.099 |
| Validation | Erbaluce | CS | 31 | 48% | 0.8238 | ||
| Validation | Erbaluce | CD | 40 | 78% | 0.0004 | ||
| Validation | Nebbiolo | NV | 33 | 55% | 0.5657 | ||
| Validation | Nebbiolo | NG | 40 | 75% | 0.0016 |
This Non-Herbicide model was then validated in the other organic (Non-Herbicide) vineyards. The results were statistically significant in two out of four cases, equally divided between Erbaluce and Nebbiolo.
The Herbicide in the framework of the weed treatments tended to elicit the total digestibility of the litterbag residues, while it apparently tended to depress the microbic C and its respiration activity in the soil (Table 8).
Table 8. The prominent litterbag variables with most influence on the Non-Herbicide/Herbicide fingerprinting.| Non-Herbicide (1) Herbicide (2) | PLS Std.Coeff |
| Soil C microbic, µg Cmic g-1 FW | -0.00507 |
| Litterbag Total Digestibility , % | 0.00522 |
Discussion
It has been confirmed in this work on the litterbag-NIRS method that the brown world can be related to the green world in an ineffable but simple empirical way. In previous experiments, several results concerning maize 11 potato 13and tomato 9 showed that litterbags could be correlated with a variation in yield, as measured in fields or large plots. In the present work, a new challenge has emerged concerning the study of the variability of a field, as it is necessary to advance in precision farming operations.
In this work, the Nebbiolo vine appeared more respondent to the fitting of the yield from the NIR spectra of the litterbags. A greater variability affected Nebbiolo yield (variation coefficient 39%) than Erbaluce (20%) with much lower means (3.41 vs. 7.23 kg plant-1). When looking at the level of the soil substrate respiration, it appeared quite limited below 100 µg Cmic g-1 FW, while it was over 300 in tomato in starting crops and then descended to a 200-100 range 9; it also was raised in maize crops to over 300 11. The vineyards involved in the present trial were mostly organic, and the NO3--N levels in the soil were in fact around 15 mg kg-1 DM for Nebbiolo, but 53% higher for Erbaluce. Interesting, the litterbag crude protein of the alpine hay used for the litterbags was low at zero time (3.3 % DM, not shown in the Table), but following the transformation, thanks to the minor decomposability of N with respect to the carbon compounds, and also because the N accumulation from microbial growth, this level reached 12.9% and 10.8 % (Table 6), thus indicating a prevalence of about 11% for Erbaluce. Despite the differences in vigor, a similar yield mechanism was elicited in both vines. In fact, the yield was positively correlated with the SIR (substrate induced respiration), a predictor of the activity of a viable microorganism. The yield increase resulted to be contra-correlated with NO3+-N, on a within vine basis, similarly to the negative regression shown for the foliar pH in Figure 1. All this is derived from the fact that the more reactive plants elicit a greater N uptake, thanks to an enhanced aerobic microbial activation of the rapid strategists that attack the decreasing ADF in the litterbags. At the same time, the rapid populations grow and their consistency groes, as testified by the increased protein level of the litterbags.
The spectral correlation of litterbags with the yield in vine has been reported here for the first time. This precedent is a stimulus to verify such relationship in other crop and orchard experiments and surveys where litterbags have been placed and collected, but the correlation has not yet been calculated. Moreover, the correlations of the litterbags with the buds and the pH of the berries are original and limited to Nebbiolo, where the variability between plants and soil clusters was greater than for Erbaluce. The canopy cover of Nebbiolo, raised under espalier conditions, is equally interesting, but not promising for development because this is a remotely detectable feature.
So, what could the non-academic interest be in extending this Litterbag-NIRS technique? Soil analyses are by definition chemical analyses 2. In fact, scientific attention is devoted to high-level studies 21,22,23. However, the litterbag technique is a frugal, indirect evaluation method of microbial activities that can be used to: 1) easily detect numerous points along rows, thereby protecting them from the need of mechanical operations on the ground, to estimate the level and variability of the respiratory activity that takes place in the soil of the whole vineyard or in parts of it; 2) receive information on the type of microbes that are active in a soil in order to suggest cultivation operations in the soil with amendments, compost, biochar and biofertilizations; 3) evaluate the dynamics of nitrogen, in order to modulate the quantity and quality of the supply, especially when the organic cultivation method is applied: in Nebbiolo, but also in Erbaluce, where excesses of the NO3--N level have appeared to limit production, due to an inadequate uptake by the roots, and the processing of the plant, as revealed by microbial respiration, but also by the non-consumed ADF fiber and the non-accumulated protein. The purpose of greening is to accumulate CO2 in the soil, but C and N are in stoichiometric ratios, and there is therefore more C and more N. Over time, Litterbags can be used to testify the validity of systematic interventions, such as grassing, crop cover, minimum or zero tillage, and symbiotic biofertilizers. New needs have arisen in viticulture that push toward change: global warming, new phytosanitary emergencies, attention to the protection of the environment, soil and biodiversity, sustainability and the challenge of climate neutrality. The Litterbag-NIRS method could make a small contribution to progress in this context through an indirect and "frugal" assessment of soil fertility. In the present work, a significant Non-Herbicide vs. Herbicide fingerprinting in litterbag features was found in one vineyard, and clearly validated in two others. Two traits appeared to be relevant from the herbicide application. First, a tendential reduction in soil respiration was found, which was not in agreement with the results on the vineyards of Mandl et al. 24. Secondly, a tendential increase in the total digestibility coefficient of the litterbags was found. This finding may be supported by considering the prevalence of slow acting k-strategist microbe populations observed for the lower respiratory activity. A total of 2411541 next generation sequences were examined in the work by Mandl 21, who observed a non-statistic increase in the yeasts, bacteria and molds of the soil, which affected the soil plots treated with herbicides: NGS analyses showed that the abundances of cultivable and not-cultivable soil bacteria under herbicide treatments were on average 264% higher than under mechanical weeding; however, no organized information has been found about the effective activity expressed by the nine classified communities of bacteria and archeobacteria. Zalleret al25observed that the herbicide variated soil colony forming units in vineyards were higher under glufosinate than under glyphosate. Moreover, the grapevine root mycorrhization was on average reduced by 53%, compared to mechanical weeding, whereas the litter decomposition in soil was unaffected by herbicides. Van Hosel et al. 26 did not witness much variation in the respiratory parameters of the soil in winter wheat microcosms after herbicide treatments, even for green tea and rooibos bags, as regards the decomposition rate (K) and the stabilization factor (S) described by Keuskamp et al.27. The Tea Bag Index27 is based on a single residue weighing and represents the total decomposition from which the K and S parameters are calculated by proportion to fixed standards. Until now, the Litterbag-NIRS method has never been compared with TBI. In the present case, which concerns a herbicide treatment, the answer provided by the Litterbag-NIRS fingerprints seems to be confirmed as it has focused on the effect of a slow respiratory footprint and on the affirmation of greater populations of the k-strategist type.
If it is common practice to refer to the Earth as a mother, but let us not forget that the Sun is the father of life on earth, and it cyclically affects the foliar pH of vines28, probably through UV variations 29, an important characteristic of the leaves that has not been considered so far, but a link with productivity, that is, more than five kg per plant per pH unity decrease, has been demonstrated in the present work.
Acknowledgments
The research was supported by the “Cantina della Serra”, Piverone, Italy and by the “Ministero delle politiche agricole, alimentari e forestali”. Thanks to Marguerite Jones for the skilful linguistic correction.
References
- 1.Swift M J, Palm C A. (2002) Soil fertility as an ecosystem concept: A paradigm lost or regained? In: Accomplishments and changing paradigm towards the 21st Century.Proceedings of the 17thworld congress of soil science. , Bangkok, Thailand 14-21.
- 2.Benedetti A, Mocali S. (2008) Analisi a livello di suolo. In: Indicatori di Biodiversità per la Sostenibilità in Agricoltura. Linee guida, strumenti e metodi per la valutazione della qualità degli agroecosistemi. ISPRA, Report 47/2008
- 3.Drusch M, Del Bello U, Carlier S, Colin O, Fernandez V et al. (2012) Sentinel-2: ESA's optical high-resolution mission for GMES operational services.Remote sensing of Environment. 120, 25-36.
- 5.Munnaf A M, Nawar S, Mouazen A M. (2019) . Estimation of Secondary Soil Properties by Fusion of Laboratory and On-Line Measured Vis–NIR Spectra.Remote Sensing11 2819.
- 6.Chaparro J M, Sheflin A M, Manter D K, Vivanco J M. (2012) Manipulating the soil microbiome to increase soil health and plant fertility.Biology and Fertility of. Soils48 489-99.
- 7.Dalias P, Mprezetou I, Troumbis A Y. (2003) Use of a modified litterbag technique for the study of litter mixtures.European journal of soil biology39. 57-64.
- 8.Masoero G, Delmastro M, Cugnetto A, Giovannetti G, Nuti M. (2018) NIRS footprint of bio-fertilizers from hay litterbags.Journal of Agronomy Research1. 22-33.
- 9.Baldi E, Toselli M, Masoero G, Nuti M. (2020) Organic and symbiotic fertilization of tomato plants monitored by Litterbag-NIRS and Foliar-NIRS rapid spectroscopic methods.Journal of Agronomy Research3. 1, 9-26.
- 10.Piazza G, Ercoli L, Nuti M, Pellegrino E. (2019) Interaction Between Conservation Tillage and Nitrogen Fertilization Shapes Prokaryotic and Fungal Diversity at Different Soil Depths: Evidence From a 23-Year Field Experiment. in the Mediterranean Area.Front. Microbiol.10 1-20.
- 11.Volpato S, Masoero G, Mazzinelli G.Balconi C,et al.(2019) Spectroscopic and foliar pH Model for Yield prediction in a Symbiotic Corn Production.Journal of Agronomy Research2. 3, 1-18.
- 12.Masoero G, Mazzinelli G, Balconi C, Locatelli S. (2020) . Spectroscopic Kernel Quality from a Symbiotic Corn Production.Journal of Agronomy Research2 4, 18-33.
- 13.Volpato S, Masoero G, Giovannetti G, Nuti M. (2020) Arbuscular Mycorrhizal Biofertilizers sources in the potato (Solanum tuberosum) plant show interactions with cultivars on yield and litterbags spectral features.Journal of Agronomy Research. 2(4), 10-17.
- 14.D H Lorenz, Eichhorn K W, Bleiholder H, Klose R, Meier U et al. (1994) . , Phänologische Entwicklungsstadien der Weinrebe (Vitis vinifera L. ssp. vinifera).Vitic. Enol. Sci 49, 66-70.
- 15.Smart R. (1985) Principles of grapevine canopy microclimate manipulation with implications for yield and quality. A review.Am. , J. Enol. Viticult 36, 230-239.
- 16.Fuentes S, Poblete-Echeverria C, Ortega-Farias S, S D Tyerman, R De Bei. (2014) Automated estimation of leaf area index (LAI) from grapevine canopies using cover photography, video and computational analysis methods.Australian. , Journal of Grape and Wine 20(3), 465-473.
- 17.Goldring D, Sharon D. (2016) Low-cost spectrometry system for end-user food analysis. , United States Patent 009377396, 2.
- 18.Masoero G, Cugnetto A, Sarasso G, Giovannetti G, Nuti M. (2019) Sunspots are correlated with foliar pH. in grapevine.Journal of Agronomy Research.2 3, 31-41.
- 19.Masoero G, Peiretti P G, Cugnetto A, Giovannetti G. (2018) Raw pH fall-out as a sign of a mycorrhizal modifier ofSorghum sudanensis. , Journal of Agronomy Research 1(2), 1-11.
- 20.Peiretti P G, Masoero G, Tassone S. (2020) Near infrared reflectance spectroscopy (NIRS) evaluation of the nutritive value of leaf and green pruning residues of grapevine(Vitis vinifera L.).In:Grapevines ata Glance. , NY, Chapter 3, 67-89.
- 21.Belmonte S A, Celi L, Stahel R J, Bonifacio E, Novello V et al. (2018) Effect of long-term soil management on the mutual interaction among soil organic matter, microbial activity and aggregate stability in a vineyard.Pedosphere. 28(2), 288-98.
- 22.Novello G, Gamalero E, Bona E, Boatti L, Mignone F et al. (2017) The rhizosphere bacterial microbiota ofVitis viniferacv. Pinot Noir in an integrated pest management vineyard.Frontiers in microbiology. 8, 1528.
- 23.Novello V, de Palma LA, Bica D, Santovito A. (2001) Photosynthesis, leaf and stem water potentials, chlorophyll and macroelement leaf concentration as influenced by two root and training systems inErbalucewine grape.Advances in Horticultural Science. 1, 17-24.
- 24.Mandl K, Cantelmo C, Gruber E, Faber F, Friedrich B et al. (2018) Effects of glyphosate-, glufosinate-and flazasulfuron-based herbicides on soil microorganisms in a vineyard.Bulletin of environmental contamination and toxicology. , Nov 101(5), 562-9.
- 25.Zaller J G, Cantelmo C, Dos Santos G, Muther S, Gruber E et al. (2018) Herbicides in vineyards reduce grapevine root mycorrhization and alter soil microorganisms and the nutrient composition in grapevine roots, leaves, xylem sap and grape juice.Environmental Science and Pollution Research.Aug. 25(23), 23215-26.
- 26.W Van Hoesel, Tiefenbacher A, König N, Dorn V M, Hagenguth J F et al. (2017) Single and combined effects of pesticide seed dressings and herbicides on earthworms, soil microorganisms, and litter decomposition.Frontiers in plant science. 8, 215.
- 27.Keuskamp J A, Dingemans B J, Lehtinen T, Sarneel J M, Hefting M M. (2013) Tea Bag Index: a novel approach to collect uniform decomposition data across ecosystems.Methods in Ecology and Evolution. 4(11), 1070-5.
Cited by (3)
- 1.Masoero Giorgio, Oggiano Philipp, Migliorini Paola, Taran Aliaksei, Nuti Marco, et al, 2022, Litterbag-NIRS to Forecast Yield: a Horticultural Case with Biofertilizer Effectors, Journal of Soil Science and Plant Nutrition, 22(1), 186, 10.1007/s42729-021-00643-5
- 2.Masoero Giorgio, Ariotti Riccardo, Giovannetti Giusto, Ercole Enrico, Cugnetto Alberto, et al, 2021, Connecting the use of Biofertilizers on Maize silage or Meadows with Progress in Milk Quality and Economy, Journal of Agronomy Research, 3(3), 26, 10.14302/issn.2639-3166.jar-21-3782
- 3.Masoero Giorgio, Sarasso Giuseppe, Delmastro Marco, Delmastro Renato, Antonini Massimiliano, et al, 2023, Soluble Biobased Substances in soil or Salicylic Acid on leaves affect the foliar pH and soil biovariability of Grapes-as explained by the NIR Spectroscopy of Litterbags and Teabags, Journal of Agronomy Research, 5(2), 10, 10.14302/issn.2639-3166.jar-23-4648