Abstract
Background:
Gingival crevicular fluid (GCF) is regarded as a promising medium for detection of periodontal disease activity. bone loss is a major feature of periodontal disease, although we are unable to determine the time of this bone loss and therefore periodontal disease activity. During orthodontic treatment small forces are applied, resulting in bone remodeling which allows tooth movement. Orthodontic model may be used as a preliminary stage in evaluating gingival crevicular fluid role in bone turnover.
Aims:
To detect GCF and to monitor it's volume and flow rate following orthodontic activation, and to determine at what stage inflammation and bone resorption reach their maximum.
Materials and Methods:
GCF samples were collected from 10 adult orthodontic patients (mean age = 22.3 , range 20-24year) on 3,7,10,14,21,28,35 days after activation of orthodontic appliance, from the tooth surface where bone resorption was expected to occur. A total of 330 GCF sample were collected using filter paper strip, the volume measured by weighing.
Results:
An insignificant increase in GCF volume and flow rate was noted in the tenth day after activation of the orthodontic appliance activation. At 35 days GCF reached its minimum flow rate. There was considerable variation between subjects and between the same subject on different days
Conclusion:
Increase in GCF volume and flow rate reflects the effect of orthodontic adjustment rather than oral hygiene, as there were no clinical inflammatory changes during the period of orthodontic treatment studied.
Author Contributions
Academic Editor: Neeti Mittal, Santosh Dental College and Hospital, Ghaziabad, India
Checked for plagiarism: Yes
Review by: Single-blind
Copyright © 2016 Najwa A. Nassrawin, et al
 This is an open-access article distributed under the terms of the Creative Commons Attribution License, which permits unrestricted use, distribution, and reproduction in any medium, provided the original author and source are credited.
Competing interests
The authors have declared that no competing interests exist.
Citation:
Introduction
Detection of an indicator of active phases of tissue destruction, particularly that of the alveolar bone during periodontal disease is the dream of dental investigators.
The short coming of current clinical indices of assessment of periodontal disease have led to the development of more precise means of determining active disease, prediction of sites of future deterioration and response to treatment. 1
Gingival crevicular fluid (GCF) is regarded as a promising medium in investigations associated with the diagnosis, pathogenesis and prognosis of periodontal disease. The exact nature of the fluid, it's origins and composition have been the subject of controversary. This may be a result of variation in the amount and / or nature of the fluid produced under different clinical conditions and the use of a wide variety of sampling methods 2 . The composition of GCF is the result of the inter play between bacterial biofilm adherent to the tooth surfaces and the cells of the periodontal tissues. A number of gingival crevicular fluid components have been reported as indicators or predictors of active periodontal disease. Collection of GCF is a minimally invasive procedure and analysis of specific constituents in GCF provides quantitative biochemical indicators for the evaluation of the local cellular metabolism that reflects a person’s periodontal health status 3.
The flow of this fluid appears to be small in health. The constituents of GCF are derived from a variety of sources, including dental plaque, host inflammatory cells, host tissue and serum. An number of GCF constituents have shown potential as possible diagnostic and prognostic markers of active tissue destruction in chronic periodontitis 3.
It is widely considered that GCF is formed as a blood infiltrate, with some metabolic elements and host cells from the gingival crevice environment 5 . GCF reflects disease severity and considered with Il-β a better marker of gingival inflammation in comparison with periodontal pocket depth and bleeding on probing 6.
GCF volume and flow rate are indicators of changes in vascular permeability which occurs in the early stages of inflammation.4 It may be representative of the early signs of inflammation 2, 5 . The outflow of this exudates helps to clean the dentogingival space of non-adherent microbes, and to reduce the concentrations of their toxins and metabolic byproducts 7.
Several techniques have been used for the collection of gingival crevicular fluid. The most common way of collection was filter paper strip, which could be extracrevicular or intracrevcular. The best technique of collection; is intracrevicular technique.8 It's considered the best way for monitoring the flow of GCF as it provides samples for quantitative analysis of the GCF components 9. Collection of GCF by filter paper strip is affected by many factors like contamination with saliva and plaque 10, 11, 12, also by any mechanical irritation like mastication, tooth brushing13, sampling time14 and smoking 15, 16
Evaluation amount of GCF collected by filter paper strip by many ways, but the best was introduced by using Periotron. It allowed accurate determination of GCF volume and subsequently laboratory investigation of the sample composition. Three models of Periotron have been produced (600, 6000, 8000), and each has been shown to be an efficient means of measuring the volume of fluid collected n filter paper strip 2.
When a small orthodontic force is applied to teeth for an adequate period of time an inflammatory event has taken place in the periodontium resulting in bone remodeling that provides the movement of teeth. In order to develop biological strategy for enhancing this movement of teeth in bone, the underlying mechanism of bone resorption and apposition should be understood in detail 17 .
When small orthodontic forces applied for a prolonged period of time inflammatory events occur within the periodontium resulting in the release of inflammatory mediators 18
The aims of this study are: to monitor the GCF flow rate and volume and to determine at what stage GCF production reach the maximum level following orthodontic activation.
Materials and Methods
Study Design
Each experimental period was run from appliance activation to the next period of activation 4-8 weeks. In order to examine the effect of the appliance activation on the GCF levels. Ten subjects were examined and samples were collected on 7 occasions over 6 weeks. Samples were collected 3, 7, 10, 14, 21, 28, and 35 days after activation of orthodontic appliance.
Subjects Selection
The subjects who participated in this investigation, who were undergoing orthodontic treatment. The inclusion criteria were presence of fixed orthodontic appliance without any kind of extractions, no signs of gingivitis or periodontitis, probing depths should not more than 3mm in the whole dentition, plaque score ≤ 30 and bleeding score ≤ 10. Systemically; subjects with good general health, no use of anti-inflammatory or anti-biotic drugs, no systemic diseases, non smokers were included.
Ethical approval for the study had been obtained according Eastman Dental Institute and London Hospital. All suitable subjects were given a verbal and written explanation of the study and a written consent was obtained. Ten subjects (6 females and 4 male) with mean age 20 years were available for sampling. The small number of the subjects was due to the frequency of sampling, and this was also, the reason for selecting subjects from amongst the staff.
Samples were collected from the teeth undergoing orthodontic movement likely to be inducing bone resorption. The collection was from the tooth surfaces where bone resorption was expected to be most pronounced e.g. distal surface of canine during retraction of canines. 2x10 mm filter paper strip (f.p.s) of Whatman 3 MM chromatography paper. were placed in the
Microcentrifuge tube with a small plastic cup positioned halfway down the centrifuge tube [a hole was created in the cup with a needle, before it was positioned in the microcentrifuge tube so the collected samples of GCF will be pooled in the lwer half each microcentrifuge tube was weighed prior to sampling with a Cahn 500 microbalance accurate to the nearest 0.01 mg.
Sites of collection were isolated with cotton rolls and a saliva ejector. High volume aspiration was used close to the area of collection in order to prevent any salivary contamination. Using a periodontal probe, the tooth surface was cleaned of any plaque or debris, without disturbing the gingiva.
Collection of GCF and Sampling Protocol
The f.p.s. was placed at the entrance of the gingival crevice. The first f.p.s. was maintained in position for 5 seconds, followed by an interval of one minute, the second f..p.s. was similarly maintained in the same position for a 5 second collection. Following an interval of 30 seconds a final f.p.s. was placed in position for a 30 second collection period. The first strip sample represents the pooled volume of GCF, and the second strip represents the GCF flow rate, and in order to increase the volume of GCF available for subsequent laboratory analysis, the third f.p.s. was used. Following GCF collection, strips were replaced and sealed in the microcentrifuge tube and reweighed. Differences in weights were calculated for each strip and represents the amount of GCF collected. GCF samples were stored inside the microcentrifuge tubes at -70°C.
Prior to GCF sampling each site was assessed for gingival color and the presence of plaque using standard clinical indices19 . After the GCF was collected, probing was performed using a William periodontal probe (0.5 mm tip diameter) and the tendency of the gingival tissues to bleed following probing was noted.
Results
GCF Volume
Figure 1 and Table 1 show the mean and standard deviation (s.d.) of the volume of GCF collected on the first strip samples, at different days following activation of the orthodontic appliance. The mean GCF volume was generally within the range 0.3 - 0.4 ml. The exceptions were at 10 days when the mean reached its maximum (0.64 ml) and at 35 days when it reached its minimum (0.17 ml). There was considerable variation between subjects and between the same subject on different days, which was reflected in the large standard deviations.
Figure 1.Mean+s.d. of GCF volume 1st strip following orthodontic appliance adjustment.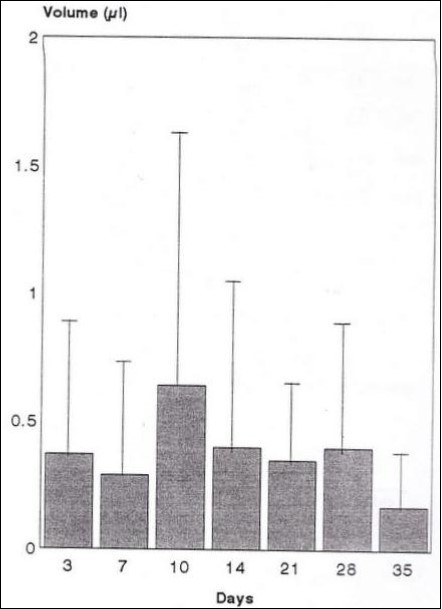
| Days | 3 | 7 | 10 | 14 | 21 | 28 | 35 |
| Number | 41 | 37 | 39 | 40 | 32 | 17 | 12 |
| Mean volume [ ml ] | 0.37 | 0.30 | 0.64 | 0.40 | 0.35 | 0.40 | 0.17 |
| s.d. | 0.50 | 0.40 | 1.02 | 0.67 | 0.33 | 0.44 | 0.20 |
Analysis of variance revealed no statistically significant differences (P= 0.140) between the volumes collected on any of the days [Table 2]. Similarly paired t-test between day 10 and day 7 (P= 0.32), and between days 10 and 35 (P= 0.09) also showed no statistically significant differences.
Table 2. Analysis of variance in the volume of GCF in first strip| Source | DF | SS | MS | F | P |
|---|---|---|---|---|---|
| Factor | 6 | 3.679 | 0.613 | 1.63 | 0.140 |
| Error | 207 | 77.774 | 0.376 | ||
| Total | 213 | 81.454 |
GCF Flow Rate
Table 3 and Figure 2 show the mean and standard deviation of GCF collected on the second strips, at different days following activation of the orthodontic appliance, which represent the flow rate of GCF. The mean values of GCF flow rate show little variation between the days of collection. Although 14 and 21 days represent high values ( 0.37 ml / minute), but still the 10 days represents the maximum value ( 0.43 ml / minute), and 35 days represents the minimum value ( 0.10 ml / minute).
However; and as previously mentioned, it is just small variations between subjects on different days. Statistical analysis using analysis of variance showed no statistically significant effect (P= 0.144) for the time of sample collection [Table 4]. Further paired t-test between days 10 and 35 (P= 0.77) showed no statistically
significant differences.
Table 3. Mean ml/ minute+ s.d. of GCF flow 2nd strip following adjustment of appliance.| Days | 3 | 7 | 10 | 14 | 21 | 28 | 35 |
| Number | 41 | 37 | 39 | 40 | 31 | 16 | 12 |
| Mean [ ml/min ] | 0.24 | 0.19 | 0.43 | 0.37 | 0.37 | 0.23 | 0.10 |
| s.d. | 0.24 | 0.24 | 0.62 | 0.72 | 0.48 | 0.23 | 0.11 |
Figure 2.Mean+s.d. of GCF flow 2nd strip following orthodontic appliance adjustment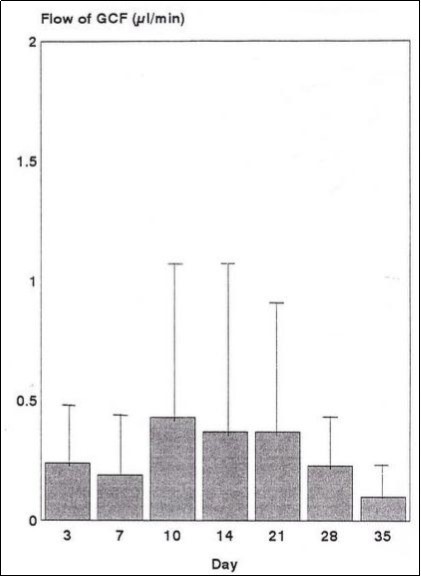
| Source | DF | SS | MS | F | P |
|---|---|---|---|---|---|
| Factor | 6 | 2.199 | 0.366 | 1.62 | 0.144 |
| Error | 206 | 46.725 | 0.277 | ||
| Total | 212 | 48.924 |
The Total Volume of GCF
Figure 3 and Table 5 show the mean and standard deviation (s.d.) of the total volume of GCF collected on the three strips at different days following activation of the orthodontic appliance. The maximum mean value (1.50ml) occurred at 10 days and it was almost 4 times the minimum mean value (0.40ml) which occurred at 35 days. The mean values at 14 and 21 days were also slightly higher than the means on the remaining days. Analysis of variance revealed no statistically significant differences between the total volume collected on any of the days [Table 6]. Similarly paired t-test of day 10 and day 35 (P= 0.10) revealed no statistically significant differences.
Figure 3.Mean + s.d. of GCF flow2nd trip following orthodontic appliance adjustment
| Days | 3 | 7 | 10 | 14 | 21 | 28 | 35 |
| Number | 41 | 37 | 39 | 40 | 31 | 16 | 12 |
| Mean | 0.92 | 0.76 | 1.50 | 1.12 | 1.11 | 0.92 | 0.40 |
| s.d. | 0.96 | 1.00 | 2.13 | 1.60 | 1.10 | 0.79 | 0.34 |
| Source | DF | SS | MS | F | P |
|---|---|---|---|---|---|
| Factor | 6 | 14.53 | 2.42 | 1.33 | 0.244 |
| Error | 217 | 394.33 | 1.82 | ||
| Total | 223 | 408.86 |
Figure 4 shows the number of sites against the pooled volume of GCF collected on the 3 strips. Ninety six sites yielded less than 0.5 ml, and a further 64 sites made 142 less than 1.0 ml. The remaining 142 sites were over 1.0 ml with majority between 1.0--0.5μl. A few isolated sites exceeded 5.0 ml total GCF.
Figure 4.Total number of samples plotted in relation to volume of GCF collected n = 303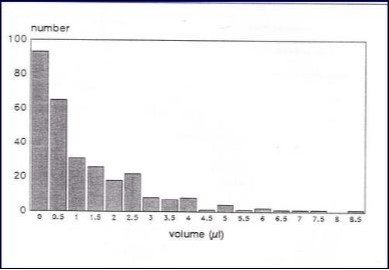
Discussion
Detection of an indicator of active phases of tissue destruction, particularly that of the alveolar bone during periodontal diseases is the dream of dental investigators. The difficulty in determining the time of disease activity led some investigators to use the orthodontic model in order to determining the phases of diseases activity.
During early tooth movement, the blood supply at the compression side in the PDL is reduced, resulting in a zone of aseptic necrosis or hyalinization. Indirect bone resorption in the medullary spaces release the pressure and capillaries can grow into the hyaline zone and the necrotic tissue can be removed by macrophages. Newly formed osteoclasts will later resorb the bone surface directly and tooth movement will resume, while the periodontal membrane is reformed 20
An increase in GCF flow may have physical protective effects through flushing the pocket, as well as facilitating the passage of immunoglobulin 3.
Selection of samples from healthy sites, was to be sure that detection of GCF will be due to bone turnover as a result of tooth movement rather than destructive periodontal disease. Although clinical indices are crude in their assessment of inflammation, and unable to detect minor changes in the periodontium, but GCF may be more sensitive in detection mild inflammatory changes. GCF volume and flow rate would better indicators of gingival inflammation than clinical assessment. Although GCF volume sometimes showed maximum value even with clinical signs of health and minimum volume even with clinical sign of inflammation12.
Collection of the three strips were used in order to detect the volume and flow rate of the GCF. Griffiths et al (1992a) 19 reported that GCF flow is better indicator of inflammation than GCF volume, as it is due to increase tissue permeability. The Samples collected by (Grieve et al 1994)21 were collected by insertion of paper strip 1mm in the healthy crevices. They do not describe the GCF volume and flow rate between treatment and control subjects, or any relation between the concentration of PGE, IL- b and the volume and flow rate of GCF.
Previous literature speculates whether orthodontic treatment or changes in the standard of the oral hygiene or both cause increase in the GCF volume and flow rate. For example Tersin et al (1978a)22 reported an increase in the GCF volume and flow rate following orthodontic treatment, although the time and frequency of collection were different from this study. They collected at 30, 60, 130, 190 days and the strips were inserted for 3 minutes. They concluded that changes in oral hygiene influenced by orthodontic treatment, lead to the increase of GCF volume and flow rate. This was in spite of the oral hygiene instruction given to the subjects. Although long period of time was used between frequent collections. The result of that revealed GCF volume and flow rate that reflect the effect of orthodontic adjustment rather than oral hygiene, as there was no clinical inflammatory changes during orthodontic treatment studied.
The increase in the GCF volume and flow rate in this study were reported in the 10 days, and a decrease in 35 days, although analysis revealed no statistical significant for this results. But 10 days may represent the time of high rate of bone turnover after activation of the orthodontic appliance, and the inflammatory response due to irritation from the orthodontic appliance, while in the 35 days the rate of bone turnover settled down. Basaran et al (2006) 23 reported an increase in the GCF volume at 7 and 21 day after 6 months of thedistilizationdistalization treatment. Ingman et al (2005) 24 collected samples from upper canine before fixed appliance activation and every 24 hours for 1 month, thereafter GCF flow was not significantly changed. Grieve et al (1994)21 reported increase in PGE and IL - b within 24 - 48 hour in teeth under orthodontic appliance in relation to control, but this increase return to base line level after 7 days. The explanation of the early detection is, may these markers represent early inflammatory response rather than bone turnover markers. The results of this study showed increase in GCF volume and flow rate in day 3 and decrease in Day 7, then there is an GCF volume and flow rate in day 10. Although (Grieve et al 1994) 21 did not mention any relation between the volume and flow rate of GCF and the detection of PGE and IL-b, but their results reported elevated level of IL-b after 1-24 hour and PGE after 24-48 hours of activation and return to the base line after 7 days.
Alfageeh and Anil ( 2014) 25 collected GCF samples after canine retraction one hour, one day , 7days, 14 days and 21days. GCF volume and ALP levels were estimated. The results showed statistically significant change in the GCF volume and ALP on the 7th, 14th and 21st days. The peak in the activity occurred on the 14th day of initiation of retraction, although the changes in the level didn't show any significant variation. Dermmond C. et al (2012)26 collected GCF samples using periotron from mesial and distal sites of maxillary canine subjected to distalizing force as test tooth and from contralateral canine not subjected to any force as control tooth at baseline immediately before applying the orthodontic appliance and after one hour, 24 hours, 7 days, 14 days and 21 days. A significant increase in the GCF volume over time was seen in the mesial of the control canine, while mesial and distal of the test canine. they concluded that subclinical tissue inflammation consequent to the placement of the orthodontic appliances might be responsible for these GCF volume. Although they concluded that GCF volume does not appear to be a reliable biomarker for tissue remodeling during orthodontic treatment.
Different results from different studies may be related to the differences in the type of appliances, treatment time and forces, in addition the majority of teeth. In this study teeth used in GCF collection were incisors and premolars with smaller gingival crevice region that may collect small volumes .
Ideally there should be more control subjects and sites involved in the study, but it is difficult to recruit an appropriate number of suitable adult patients with this frequency of GCF collection. The variation in the results from different studies may be due to variation in the sampling and analyzing techniques. Ideally it should be more subjects and sites involved in the study, but it's difficult to recruit an appropriate number of suitable adult patients with frequency of GCF collection. As possible solution in to use animals and apply exactly the same treatment using constant orthodontic forces with frequent sample collection
Conclusions
GCF volume and flow rate increased at day 10 after activation of orthodontic appliance, Furtherin order more However; clinicians are still missing a practical test based tissue degradation products, that accurately indicates an initial periodontitis process, active disease or effective healing.
Conflict of Interest and Source of Funding Statement:
Authors declare that they have no conflict of interests. This study was supported by Eastman Dental Institute Research Fund and London Hospital University of London
Declaration of Helsinki
The research was undertaken with the understanding and written consent of each subject and according to the Medical Association Declaration of Helsinki
References
- 1.Mah J, Prasad N. (2004) Dentine phosphoproteins in gingival crevicular fluid during root resorption. , European Journal of Orthodontics: 26(1), 25-30.
- 2.Griffiths G S.2003Formation, collection and significance of gingival crevice fluid. , Periodontol2000 31, 32-42.
- 3.CME Champagne, Buchanan W, Reddy M S, Beck JD Preisser, Offenbacher S. (2003) Potential for gingival crevice fluid measures as predictors of risk for periodontal diseases. , Periodontology2000 31, 167-180.
- 6.Hynn O H, Jiro H, Hideki T, Yorimasa O. (2015) Effects of initial periodontal therapy on interleukin-1β level in gingival crevicular fluid and clinical periodontal parameters. , Journal of Oral Science 57(2), 67-71.
- 7.Delima A J, Van Dyke TE. (2003) Origin and function of the cellular components in gingival crevice fluid. , Periodontol2000 31, 55-76.
- 8.Brill N. (1962) The gingival pocket fluid. Studies of its occurrence, composition and effect. Acta. Odontology Scandanavia 20;supplementum32 .
- 9.Egelberg J, Attström R.Comparison between orifice and intracrevicular methods of sampling gingival fluid. , Journal of Periodontal Research 1973(8), 384-388.
- 10.Martin P, P D Aoust, R G Landry, Valois M. (1994) The reliability of the periotron 6000 in the presence of plaque. Cand Dent AssociationJ.1994 60(10) : 895-898.
- 11.D’Aoust P, Landry R G. (1994) The effect of supragingival plaque on crevicular fluid measurements See comment inPubMed Commons belowInternationalDentalJournal.;44[2]:. 159-64.
- 12.Griffiths G S, Wilton J M.Curtis MA.1992b Contamination of human gingival crevicular fluid by plaque and saliva. , Archs of Oral Biology 37(7), 559-564.
- 13.Brill N, Krasse B. (1958) The passage of tissue fluid into the clinically healthy gingival pocket. , Acta. Odontol. Scand 16, 233-245.
- 14.Griffiths G S, Wilton J M, Curtis. (1997) Permeability of the gingival tissues to IgM during an experimental gingivitis study in man . Arch Oral Biol.1997Feb;42[2]:. 129-36.
- 15.Luthra K.Grover1 H,Nidhi Aggarwal1,Luthra2et S.2012Smoking swings of gingival crevicular fluid secretion. , Journal of Indian Society of Periodontology 16(1), 101-103.
- 16.Morozumi T, Kubota T, Sato T, Okuda K, Yoshie H. (2004) Smoking cessation increases gingival blood flow and gingival crevicular fluid. , J Clin Periodontol 31(4), 267-72.
- 17.Isik F, Sayinsu K, Arun T, Unlüçerçi Y. (2005) Bone marker levels in gingivalcrevicular fluid during orthodontic intrusive tooth movement: a preliminary study. J Contemp Dent Pract.15;6[2]:. 27-35.
- 18.Norton LA LowneyJ, Shafer D M, Rossomando E F. (1995) Orthodontic forces increase tumor necrosis factor alpha in the human gingival sulcus. , Am J OrthodDentofacial Orthop 108(5), 519-24.
- 19.Griffiths G S, J A Sterne, J M Wilton, K A Eaton, Johnson N.W.1992a Association between volume and flow rate of gingival crevicular fluid and clinical assessments of gingival inflammation in a population of British male adolescents. , J. Clin. Periodontol 19(7), 464-470.
- 20.Masella R, Meister M. (2006) Current concepts in the biology of orthodontic tooth movement. , American Journal of Orthodontics and Dentofacial Orthopedics 129, 458-468.
- 21.Grieve W G, Johnson GK 3rd, Moore R N, Reinhardt R A, Duboiset L M. (1994) prostaglandin E ]PGE] and interleukin-1β [1L-1β] levels in gingival crevicular fluid during human orthodontic tooth movement. , American Journal of Orthodontic and Dentofacial Orthopedic 105(4), 369-374.
- 22.Tersin J, Brill N. (1958) Influence of capillary permeability on flow of tissue fluid into gingival pockets. , Acta. Odont. Scand 17, 23-33.
- 23.Başaran G, Ozer T, Kaya F A.Hamamci O.Interleukins 2, 6, and 8 levels in human gingival sulcus during orthodontic. treatment.2006 Seecomment in PubMed Commons belowAmericanJournalofOrthodonticandDentofacial Orthoppedic 130(1), 7-1.
- 24.Apajalahti S IngmanT1, Mäntylä P, Savolainen P, Sorsa T. (2005) Matrix metalloproteinase-1 and -8 in gingival crevicular fluid during orthodontic tooth movement: a pilot study during 1 month of follow-up after fixed appliance activation. , EurJOrthod 27(2), 202-7.
Cited by (1)
- 1.Ren Wei, Murawsky Michael, La Count Terri, Wanasathop Apipa, Hao Xin, et al, 2019, Dissolution Chamber for Small Drug Delivery System in the Periodontal Pocket, The AAPS Journal, 21(3), 10.1208/s12248-019-0317-y