
Abstract
Obesity is associated with functional limitations in muscle performance. The true effect of obesity on skeletal muscle mass, including any interactions with aging effects, remains to be elucidated. The present study investigated the impact of obesity on the stimulation of muscle growth, based on a new model of body composition.
A dataset of 44 men and 64 women was analysed. Body weight (Wt), body height (Ht), hand circumference (HdC) and waist circumference (WC) were measured. Processed by the Dahlmann-Body-Analysis (DBA) system, a new model of body composition, the increase of skeletal muscle mass (ΔSMM) compared to the individual reference weight was calculated. Muscle mass data derived by the DBA model are compared with DXA-derived predictive equations of studies representing different countries and ethnicities estimating the appendicular skeletal muscle mass. Means of these groups are tested by ANOVA.
Age ranged from 18 to 72 years. All subjects had a BMI ≥ 29.7 (kg/m²). The mean values of ΔSMM as an estimate of muscle mass gain calculated by the DBA-system were 11.8 ±3.6 kg for men and 8.9 ±2.6 kg for women, respectively, demonstrating a linear, significantly rising relationship with BMI (ß > 0, p<0.001). The study population did not show a decrease in muscle mass with age in either men or women up to an age of 65 years.
The results suggest that the present model has satisfactory prediction qualities to detect an increase in skeletal muscle mass associated with a growing burden of body fat.
Author Contributions
Academic Editor: Mohan Lal, Assistant Professor, Irrigation and Drainage Engineering department, College of Technology, G B Pant University of Agriculture and Technology, Pantnagar, India-263145.
Checked for plagiarism: Yes
Review by: Single-blind
Copyright © 2025 Nicolaus Dahlmann, et al
 This is an open-access article distributed under the terms of the Creative Commons Attribution License, which permits unrestricted use, distribution, and reproduction in any medium, provided the original author and source are credited.
Competing interests
The authors have declared that no competing interests exist.
Citation:
Introduction
The prevalence of obesity is a major public health concern. An increasing degree of obesity is associated with an increased risk of developing a variety of conditions, such as non-insulin dependent diabetes mellitus and inflammatory risk potentials 1, 2.
Obesity is associated with functional limitations in muscle performance and an increased likelihood of developing functional disabilities such as mobility, strength, and dynamic balance limitations. The consensus is that individuals of obesity, regardless of age, have greater absolute maximal muscle strength than normal-weight individuals do, suggesting that increased adiposity acts as a chronic overload stimulus on antigravity muscles, thereby increasing muscle size and strength. For a review, see 3. Current evidence demonstrating the effect of obesity on muscle quality is limited. Thus, the true effects of obesity on skeletal muscle size, structure and function, including any interactions with aging effects, remain to be elucidated. One problem is the discrepancy of nomenclature for the same outcome parameters, which hinders comparisons between studies. For review, see Walowski et al. 4.
Aiming to solve this issue, this study refers to an anthropometric model called the Dahlmann-Body-Analysis (DBA), which uses simple anthropometric parameters to define a reference weight (Ref-Wt). It is based on hand circumference as a proxy for the skeletal frame, which is essential for final body weight and results in a strong concordance with Metropolitan Life Insurance data indicating that the DBA model may reflect the body shape of the white European and American populations at that time 5. The results were consistent with data elaborated by Heymsfield et al. 6 using the traditional allometric model. They were able to show that not only the skeletal frame but also anatomical body compartments like skeleton muscle mass (SMM), lean body mass (LBM), fat mass (FM) and the organs liver and brain scale to height with the power of 2. A significant deviation from this rule is the scaling of bone to height. The implications for the DBA model are that lean tissue compartments do not need to be scaled with height in contrast to bone mass. The results underline the necessity that any model for assessing body composition needs the implementation of a bone mass variable. Further details can be found in 5, 6.
In addition, the circumference of the abdomen as a proxy for central obesity was introduced into the model. Processed through a network of algorithms the DBA model enabled to differentiate the Difference Weight – that means the difference between the Actual Weight and the Reference Weight – into fat mass (ΔFM, kg) and skeletal muscle mass (ΔSMM, kg). The calculated FM (kg) given in percent (%FM) matched with a high validity and precision with that of an eight-electrode BIA device 7. The extend to which the calculated muscle mass values (ΔSMM, kg) reflect real body composition is the intention of the present study.
For this reason, results will be compared through the use of predictive equations, obtained from a review including all types of studies that measured appendicular skeletal muscle mass (ASM) by DXA and estimated/validated the skeletal muscle mass (SMM) with equations using anthropometric variables 8. ASM is also called appendicular lean soft tissue (ALST). ALST is usually used as a good surrogate for SMM, and for this reason, both terms are often used interchangeably by some authors. The DXA-derived ASM mass is considered equivalent to the sum of the lean soft tissue (LST) in both the right and left arms and legs. The appendages were isolated from the trunk and head and provide the mass of LST, fat, and bone mineral for the whole body. ASM is highly correlated with whole body intermuscular adipose tissue (IMAT)-free SMM 9. IMAT defines the adipose tissue found between and within muscle groups. It is relatively small (approximately 1-2 kg) and varies in magnitude with body mass, age, sex and race 9.
Therefore, this study aims to answer the following questions: (1) Does overweight increase muscle mass? (2) Can the increase be quantified? (3) Can the result be verified by DXA derived predictive equations? (4) Can the DBA model serve as a standard for further muscle mass investigations?
Materials and methods
Systematic of the DBA model
The plasticity of the human body with respect to surface and composition in connection with a lack of a standard model was the reason thatDahlmann et al. searched for a population of reference, which was found in the “Schlegel” material 10.
It is based on measurements taken by W. Schlegel on 1749 young adults aged 18 to 30 years for men and 17 to 30 for women, all living in Hamburg, Germany and includes the variables height (Ht), weight (Wt) and hand circumference (HdC). The studies were carried out between 1955 and 1973, at a time when no ready-to-eat environments for the risk of incident heart failure [11) and the corresponding restaurant chains existed in Germany.
Deduced from this reference population and on the basis of multiple regression equations including the parameters height, weight and hand circumference, the DBA system allowed for the first time the calculation of a reference weight (RefWt) for each individual. Details of the calculation were previously published 5. It is a standard independent of age.
The limitation of the model at this stage of design was the inability to distinguish between muscularity and fat tissue. For that reason, the circumference of the waist (WC), a marker for central obesity, was integrated into the model. Processed by a network of algorithms, it enables the differentiation of the difference weight – that means the difference between the actual weight (ActWt) and the reference weight (RefWt) – into fat mass (FM, kg) and muscle mass (MM, kg). The implementation of waist circumference in the DBA model as a proxy for body fat resulted in a strong concordance with BIA measurements 7. The quantification of fat mass made it possible to determine the lean body mass (LBM), which is defined as a fat free corpse and is calculated by subtracting the fat-mass values from body weight. A schematic illustration of the DBA model is shown in Figure 1 (Figure 1).
Figure 1.System of the DBA model.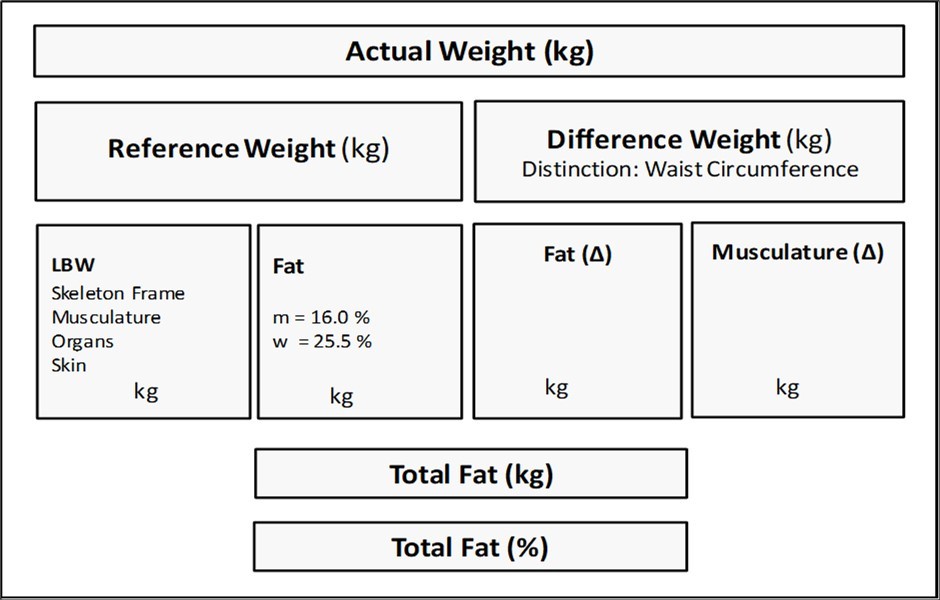
The purpose of this study is to discuss how meaningful the calculation of muscle mass is. It should be emphasised here that the DBA model calculates the delta (Δ) muscle mass. That is, the increase in muscle mass compared to the reference population, in contrast to DXA-based measurements, which result in the appendicular soft tissue (ASM). ASM is calculated as the sum of bone-free lean tissue in the arms and legs 12. Evaluation of the DBA results is possible by calculating the DXA-based muscle mass of the study population and the corresponding population of reference. The difference should correspond to the DBA results.
Subjects
For this cross-sectional study, subjects were recruited from October 2019 to July 2021 at the obesity consultation hour of the endocrinology department of the University Hospital of Bonn, Germany, and were candidates for bariatric surgery. All participants were of European descent and inhabitants of the district Bonn. They had a BMI ≥ 29.7 kg/m² and their age ranged from 18 to 72 years for men and 18 to 65 years for women. Exclusion criteria were pregnancy, oedema, skeletal malformation, acute diseases (i.e., overt organ failure), and inability to stand in an upright position. The list of participants is largely identical to that published previously in the supplementary material 7. All study procedures were performed according to the ethical standards of the World Medical Association’s Declaration of Helsinki, and were approved by the institutional ethics review board. Written informed consent was obtained from each patient prior to enrolment.
Equations to predict skeletal muscle mass
The equations are taken from a scoping review, which gathered 122 DXA based formulas of 18 countries 8. All equations were copied from this review with the exception of Tian 13, Kulkarni 12, and Wen 14. These formulas are based on the original paper. Other estimation formulas not derived from DXA measurements e.g. those of Heymsfield et al. 15 were not considered – although of interest.
Equations are selected according to the following variables sex, age, weight (Wt), height (Ht), waist circumference (WC), and derived indices such as BMI (kg/m²). The weight is given in (kg), the height in (cm). Inclusion criteria were formulas, selected according to sex, healthy condition, sample size ≥ 100, age ≥ 18 years, and accuracy (coefficient of determination, R²) ≥ 0.7, with the exception of Tanko E11 (R²=0.58).
Men
Tian, North America
ASM = 0.443*Wt + 0.011*Ht – 0.284*WC ─ 0.013*Age + 16.36 (E1)
Lee, Korea
ASM = 0.327*Wt + 0.079*Ht – 0.124*WC – 0.012*Age -1.55 (E2)
Furushima, Japan
ASM = 0.46*Wt - 0.251*WC + 12.87 (E3)
Tian,North America
ASM = 0.214*Wt + 0.144*Ht – 0.071*Age – 12.70 (E4)
Visvanathan, Australia
ASM = 0.353*Wt – 0.621*BMI ─ 0.023*Age + 15.14 (E5)
Kulkarni, India
ASM = 0.2*Wt + 0.14*Ht – 0.045*Age – 13.43 (E6)
Wen, China
ASM = 0.193*Wt + 0.107*Ht – 0.037*Age – 6.79 (E7)
Women
Tian, North America
ASM = 0.229*Wt + 0.081*Ht – 0.055*WC – 0.024*Age – 5.14 (E8)
Lee, Korea
ASM = 0.21*Wt + 0.09*Ht – 0.037*WC – 0.002*Age ─ 7.82 (E9)
Tian, North America
ASM = 0.184*Wt + 0.103*Ht – 0.033*Age – 10.11 (E10)
Tanko, Denmark
ASM = 0.11*Wt + 0.161*Ht – 0.05*Age – 13.3 (E11)
Visvanathan, Australia
ASM = 0.353*Wt – 0.621*BMI - 0.023*Age + 10.05 (E12)
Furushima, Japan
ASM = 0.138*Wt + 0.155*Ht - 16.29 (E13)
Kulkarni, India
ASM = 0.17*Wt + 0.10*Ht – 0.028*Age - 9.85 (E14)
Wen, China
ASM = 0.193*Wt + 0.107*Ht – 0.037*Age – 10.95 (E15)
The same equations are used for the Study Population and the Reference Population, which address the corresponding body weights in the formula.
Measurements
All measurements were taken by two operators, the second was instructed by the first before he retired. Body weight was measured to the nearest ±0,1 kg using the body weight scale of a BIA device (Omron BF511, Kyoto, Japan) with the patient standing in the centre ofthe scale platform, barefoot, and wearing underwear. Body height (Ht) was obtained with a stadiometer (seca, Hamburg, Germany) with the patient standing, barefoot with the heels together, back upright, and arms stretched next to the body. Hand circumference (HdC) was measured by positioning a no stretchable measuring tape in the horizontal plane over the base joints of the 2nd to 5th fingers. The hand should be strained and the thumb splayed. The left hand is chosen for right-handed people, the right hand for left-handed people. The circumference of the waist (WC) was measured at the level of the iliac crest passing it along the umbilical level at the end of normal expiration while participants were asked to lie supine. Measurements were taken by fitting the tape snugly without compressing the underlying soft tissue. Readings of all measurements were taken to the nearest mm (±0.1 cm). BMI was calculated as weight divided by height in square meters (kg/m²).
The study was performed in a double-blind form. Measurements were taken in Bonn, send to the first author, processed by the Dahlmann-Body-Analysis (DBA) system and sent back.
Statistical analyses
The characteristics of the study population are presented as medians, means ± standard deviations (SD) and the min and max values for continuous variables. Relationships between variables were examined using Pearson`s product-moment correlation coefficients (r). Observed correlation coefficients were analysed to be different to zero using Fisher t-distribution. Associations between anthropometric variables and BMI were analyzed by linear regression analysis. The slope of the regression line was tested to be significant by t-test. The goodness of fit was assessed by coefficient of determination (R²) and the standard error of the estimate (SEE). Significance of determination coefficient between variables were tested by F-test. Mean values of DXA derived muscle mass studies were compared by analysis of variance (ANOVA). All statistics were performed in Excel (Office 2019, Microsoft Corporation, USA). Tests not available in Excel were calculated by hand. A p-value < 0.05 was considered statistically significant.
Results
A dataset of 44 men and 64 women was analysed with regard to their muscle mass processed by the DBA system. Characteristics of participants are presented in Table 1, stratified by sex (Table 1). Details about the Ref. Population have been previously published (10, 5). The Ref. Weight plus ΔFM plus Δ SMM equals the Actual Weight.
Table 1. Anthropometric characteristics of the study group| Men | Women | |||
| Study Population | n = 44 | n = 64 | ||
| Mean | ±SD | Mean | ±SD | |
| Age (years) | 45.5 | 13.0 | 41,9 | 12,5 |
| Height (cm) | 179.3 | 7,6 | 166,2 | 6,2 |
| Actual Weight (kg) | 118.7 | 18,5 | 108,3 | 16,9 |
| HdC (cm) | 21,8 | 1,6 | 19,5 | 1,0 |
| WC, cm | 123.8 | 13,1 | 118,9 | 11,7 |
| Ref. Weight (kg) | 73.1 | 6,0 | 60,8 | 4,3 |
| BMI (kg/m²) | 36,7 | 4,9 | 39,1 | 5,1 |
| LBM (kg) | 71,3 | 7,0 | 54,2 | 4,8 |
| Δ FM (kg) | 33.7 | 11,7 | 38,7 | 12,5 |
| Δ SMM (kg) | 11,8 | 3,6 | 8,9 | 2,6 |
| Δ SMMI (kg/m²) | 3,7 | 1,0 | 3,2 | 0,9 |
| Ref. Population | n = 1111 | n = 636 | ||
| Age (years) | 24,4 | 3,4 | 22,4 | 3,3 |
| Height (cm) | 175,7 | 6,3 | 164,5 | 5,7 |
| Weight (kg) | 69,1 | 7,3 | 56,8 | 6,3 |
| HdC (cm) | 20,9 | 1,0 | 18,2 | 0,8 |
Age ranged between 18 and 72 years. All the subjects had a BMI ≥29.7 (kg/m²). Men had greater height, weight, waist and hand circumferences but age, BMI and ΔSMM, notably if adjusted to height (ΔSMMI), were similar regardless of sex. In detail, the mean values of ΔSMM as an estimate of muscle mass increase calculated by the DBA-system were 11.8 ±3.6 for men and 8.9 ±2.6 for women, respectively. The derived index ΔSMMI revealed values of 3.7 ±1.0 for men and 3.2 ±0.9 for women, respectively.
Pearson`s correlation coefficients (r) between Age and Actual Weight, LBM, ΔSMM and ΔSMMI are -0.01, -0.04, -0.06, and -0.06 for men and -0.16, -0.12, -0.09, and -0.05 for women, respectively. All values are not significantly different from zero (p > 0.05). Consequently, the association (slope) between age and muscle mass adjusted for height (ΔSMMI), calculated as a univariate linear regression model, was not significantly different from zero (ß = 0) for men (p = 0.74) and women (p = 0.72), respectively (Figure 2).
Figure 2 (a-b).Relation between age and the increase of muscle mass, height adjusted, in men (a) and women (b). The slope of the regression lines was not significantly different from zero (ß = 0, p>0.05), calculated by linear regression model.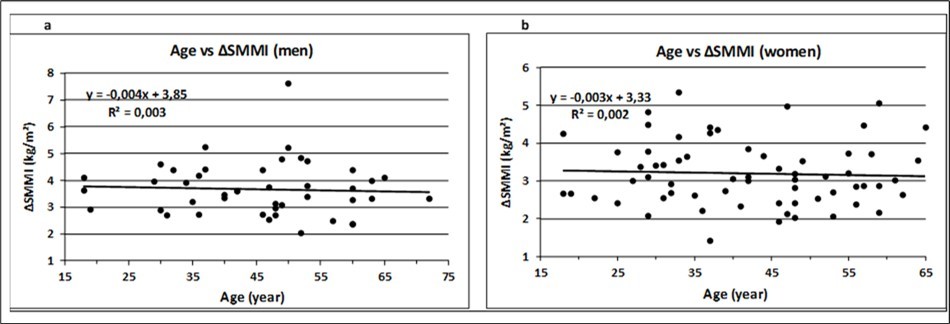
The association between BMI and Actual Weight, LBM, ΔSMM and ΔSMMI are presented for men and women in Figure 3 (Figure 3a – Figure 3h).
Figure 3 (a-h).Association of anthropometric variables with BMI for men and women. The corresponding regression equations, R², SEE, slope and p values are displayed in Table 2. Trend lines were calculated as linear regressions.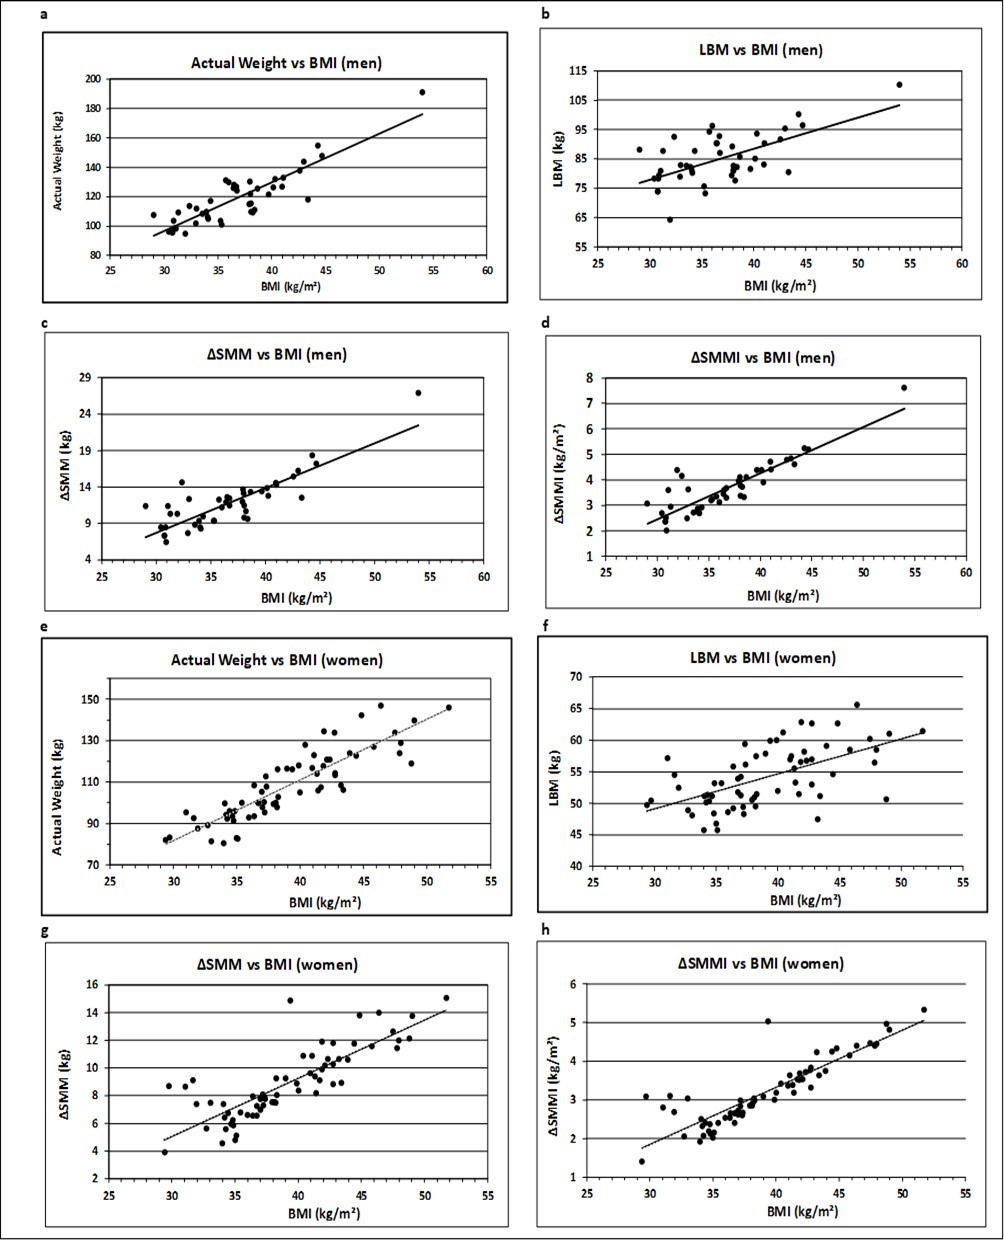
The graphical representation shows a linear relationship for all the parameters. The equations of the corresponding regression lines are given in Table 2. The indicated regression coefficient represents the slope ß, which is a measure of the contribution of muscle mass toward the corresponding BMI. A positive relationship is represented by a rising (ß > 0) regression line. The t-test revealed significant rising slopes for all the anthropometric parameters (p < 0.001).
Table 2. Regression analysis of Anthropometric Variables vs. BMI| Anthropometric Variables | Linear Regr. Equation | R ² | SEE | Slope | p-value |
|---|---|---|---|---|---|
| Men | |||||
| Actual Weight (kg) | y = 3.31x - 2.79 | 0.78 | 2.74 | ß > 0 | <0.001 |
| LBM (kg) | y = 0.89x + 39.00 | 0.39 | 4.21 | ß > 0 | <0.001 |
| Δ SMM (kg) | y = 0.62 - 10.71 | 0.72 | 2.76 | ß > 0 | <0.001 |
| Δ SMMI (kg/m ² ) | y = 0.18x - 2.95 | 0.77 | 2.04 | ß > 0 | <0.001 |
| Women | |||||
| Actual Weight (kg) | y = 2.93x - 6.43 | 0.77 | 2.45 | ß > 0 | <0.001 |
| LBM (kg) | y = 0.56x + 34.4 | 0.35 | 4.13 | ß > 0 | <0.001 |
| Δ SMM (kg) | y = 0.42x - 7.55 | 0.67 | 2.93 | ß > 0 | <0.001 |
| Δ SMMI (kg/m ² ) | y = 0.15x - 2.59 | 0.76 | 2.48 | ß > 0 | <0.001 |
Actual Weight includes fat mass and presents in comparison with BMI a goodness of fit described by coefficient of determination (R²) of 0.78 for men and 0.77 for women, respectively. This value decreases to 0.39 and 0.35 for men and women, respectively, concerning LBM and increases again, when only the increase in muscle mass is considered, in particular, when it is adjusted by height² (ΔSMMI), to a level of 0.77 for men and 0.76 for women, respectively. This process of transformation reduces the variance of residues (SEE) from 2.74 to 2.04 for men and from 2.45 to 2.16 for women, if the outlier is not considered (Figure 3h).
In summary, severe obesity induces a mean increase in muscle mass in a magnitude of 11.8 kg for men and 8.9 kg for women, as deduced from the DBA model, showing a linear relationship to BMI and a low variability between both parameters. However, as emphasized, this is a model and raises the question of validity: does the study evaluates what it is intended to evaluate? For this reason, the data are compared with DXA-based muscle mass analysis data from 7 studies performed in 7 countries including 15 formulas and adapted to the Study and Reference Population.
The results are presented in Table 3 for men and Table 4 for women. The formulas E1, E2, and E3 for men and E8 and E9 for women include WC measurements. The mean values of E1, E2, and E3 are equal (p = 0.55) for men and those of E8 and E9 are equal (p = 0.08) for women, tested by ANOVA. The formulas E4-E7 for men and E10-E15 for women show a heterogeneous picture between different countries. The mean values are significantly different (p < 0.005), for both men and women of the Study Group and the Reference Group as well, as tested by ANOVA.
Table 3.The difference between the Study- and the Reference-Population is the increase in ASM.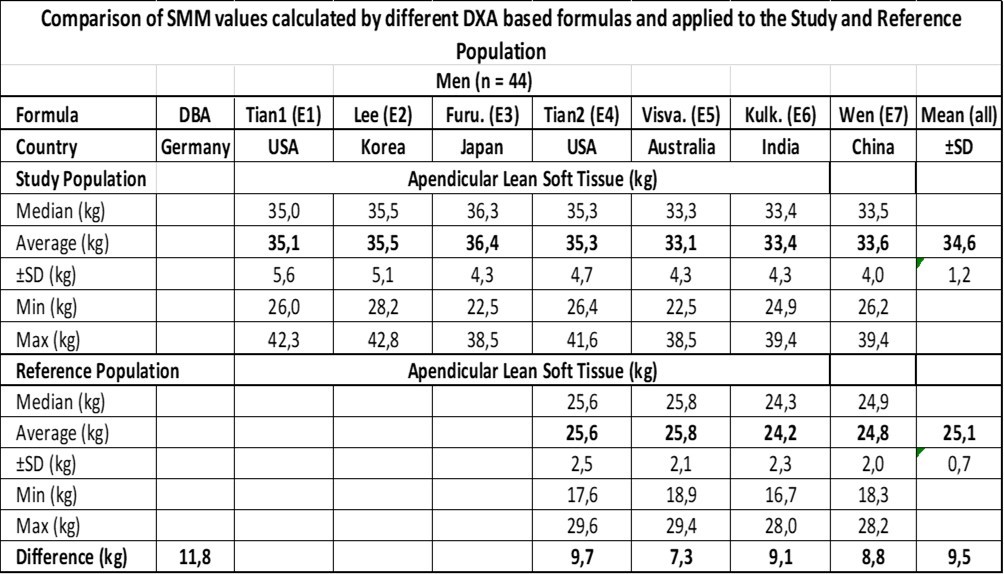
Table 4.The difference between the Study- and the Reference-Population is the increase in ASM.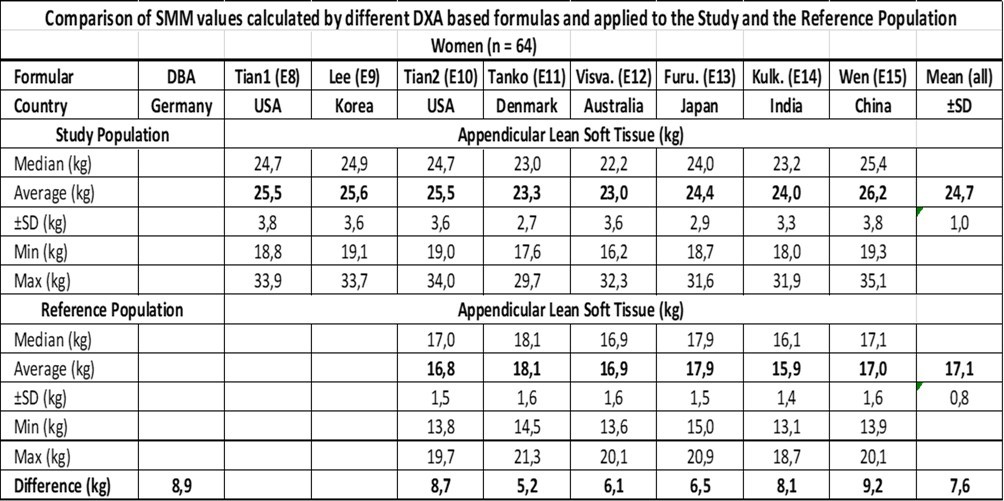
The mean ASM value ±SD of all the formulas is 34.6 ±1.2 kg for the Study Population and 25.1 ±0.7 kg for the Ref. Population resulting in a difference of 9.5 kg compared to 11.8 kg derived by the DBA model with reference to the male population. Concerning the female population, the mean ASM value ±SD of all the formulas was 24.7 ±1.0 kg for the Study Population and 17.1 ±0.8 kg for the Ref. Population resulting in a difference of 7.6 kg compared to 8.9 kg derived by the DBA model.
If the ASM values are adjusted to the SMM tissue in a magnitude of +20%, the results are 11.4 kg vs. 11.8 kg for men and 9.1 kg vs. 8.9 kg for women, respectively, when the DXA derived results are compared with the DBA model.
Discussion
Skeletal muscle mass, a key component of human body composition, is highly correlated with physical function and health status 16. Sarcopenia, characterized by the loss of skeletal muscle mass and strength with age, has been associated with low endurance capacity, physical disability, poor quality of life and death. 17. Therefore, accurate and practical measurement of skeletal muscle mass is important for research and clinical practice related to sarcopenia. Appendicular skeletal muscle mass (ASM) measured by DXA is a relevant indicator of body muscle mass, and is widely used in the diagnosis of sarcopenia 18. However, CT, MRI and DXA are impractical for large epidemiological studies because of their high cost, radiation exposure and lack of access to technical equipment. Simple, valid, reliable and inexpensive methods for measuring skeletal muscle mass are still needed. A practical alternative for estimating muscle mass could be anthropometry.
The present study investigated the impact of obesity on the development of SMM. Figure 3 demonstrates an increase in the association (R² and SEE) between Actual Weight, LBM, ΔSMM and ΔSMMI with BMI. The result underlines that the relationship between BMI and SMM becomes more specific, when body weight is virtually stripped of fat mass and organs and normalized for height squared (for discussion see 5). Other studies have reported that skeletal muscle mass measured by MRI increases with body weight, but the data were not height adjusted 19. The increase in muscle mass is speculated to be the result of impaired obesity-associated insulin resistance with increased chronic insulin levels, which may stimulate muscle hypertrophy through an enhanced protein synthesis 20. A histogram shows that a cluster of BMI values (25 < 40 kg/m²) associated with increasing amounts of muscle mass (kg) is significant (ANOVA), but no further characterization (mean values, correlation, regression) is reported 20.
Pearson´s correlation coefficients between Age and Actual Weight, LBM, ΔSMM and ΔSMMI, did not significantly differ from zero (p > 0.05) and showed no signs of decrease with age (Figure. 2), meaning that there is no association between age and muscle mass up to a life-span of 65 years. This result is consistent with the observation that there is a curvilinear relationship between age and SMM, with a change in the slope of the regression line occurring approximately at 45 years of age in both men and women 21.
The IMAT compartment assessed as the percentage difference between ASM (kg) and total body SMM (kg), was estimated to be 20% in our study group for men and women. These results far exceed the values measured in subjects with anorexia nervosa (1.4%) and male and female athletes (approximately 11.0%) (9, recalculated from Table 2). The data highlight the impact of nutritional status as a variable on muscle structure. Our data support the finding that greater adiposity is accompanied by enlargement of the SMM compartment, meaning that people who are overweight have more SMM in terms of age and height than normal weight people do 22.
This is a very tempting result, as it suggests a linear association of the IMAT from anorexia nervosa (1.4%) to obesity (20%). However, the results are based on a heterogeneous picture of equations. It cannot be excluded that the calculated ΔSMM values of the DBA model for women (8.9 kg) equal those of the DXA-derived results, e.g., the difference between the Tian equations (E8-E10 = 8.7 kg), suggesting that the calculated muscle mass of the DBA model resembles that of an IMAT-free structure. The answer to this question is reserved for future investigations and is of crucial interest, as IMAT was found to be a significantly higher independent correlate of insulin resistance in premenopausal African Americans than in their white counterparts 19.
Obesity is associated with functional limitations in muscle performance. There is a consensus that individuals of obesity, regardless of age, have greater absolute maximal muscle strength than normal-weight individuals do, suggesting that increased adiposity acts as a chronic overload stimulus on antigravity muscles. For discussion see Tomlinson et al. 3. The question therefore arises as to whether individuals, who have been overweight for many years, increase muscle strength in the lower limbs by carrying more inert mass during daily activities.
One of the first studies to investigate the effects of obesity on muscle strength in an adult population was conducted by Hulens et al. 23. The authors reported that women with obesity had significantly higher isokinetic knee extension, trunk extension, flexion and rotational torque than lean individuals, whereas no impact of obesity was found on handgrip strength. The importance of age classification and its effect on muscle strength has been demonstrated in a separate study, which accounted for the confounding age factor and reported that older people of obesity (41–65 years) had significantly lower knee extension isokinetic torque than their younger counterparts (18–40 years) 24. This is inconsistent to our results, which revealed no correlation between age and a number of different weight variables (see Figure. 2), indicating that there might exist a discrepancy between muscle mass and muscle strength.
The reason for this observation may be the above-described relationship between adiposity and the accompanying enlargement of the SMM compartment by fat (IMAT), resulting in a disturbed physiology of muscle structure. This assumption is supported by a study showing that increased muscle mass as a result of obesity is not associated with muscle strength 20.
Thus, the effect of obesity on skeletal muscle size, structure and function appears to be a dynamic process involving possible interactions with aging effects, physical activity and fat tissue alterations and remains to be elucidated. Unifying prediction equations including the aforementioned variables might have limitations here, as they describe, at the end, the investigated study population. This impression is supported by leave-one-out validations coming to the point that developed regression equations have high validity when applied to samples of subjects similar to the one on which they were developed 9.
Reference values for SMM vary widely depending on the outcome parameter and reference population. The adverse effects of obesity on muscle quality and function require the normalization of SMM for fat mass, but all current definitions disregard, thus far, the relationship between fat mass and lean mass. For this reason, an attempt has been made to provide novel BMI-dependent SMMI cut-offs 4. The degree to which DBA-derived SMMI results are equal to these values, needs to be analyzed in future studies.
To answer these questions, it becomes clear that the DBA model could provide a unifying platform for further studies to be conducted under standardized conditions. Furthermore, as the DBA model is based on a reference population, whose traits were developed decades ago, it has the characteristic of a time capsule simulating a longitudinal study. The model thus fulfils the criteria required by Wen 14, for example, to be simple, valid, reliable and inexpensive for measuring skeletal muscle mass and does not require access to expensive instruments.
To the best of our knowledge, this is the first study to demonstrate a linear relationship between increasing fat mass and muscle mass. The only data pointing in the same direction can be found in the supplementary material of Hwaung et al. 22.
Our study has several limitations. First, the main limitation of the study is that the results compared with those of the DXA-derived equations are based on descriptive statistics. In particular, the quantification of the IMAT needs to be confirmed by future studies that include anthropometric parameters such as waist circumference, as already proposed by Tian et al. 13, and a trait of skeleton frame such as hand circumference. Second, this study included people with morbid obesity who were candidates for bariatric surgery, which may cause selection bias. Third, our study population did not show a decrease in muscle mass with age. However, most of the equations used in this comparative study include a term for age, and it is questionable whether the validated equations remain accurate with age 8. This factor has the potential to introduce selection bias and limits the generalisability of the results.
Conclusion
The present study investigated the impact of obesity on the stimulation of muscle growth. Values deduced from the DBA model predicted SMM. As a result, a linear relationship was found between BMI and SMM increase (ΔSMM), with no difference in the goodness of fit between men and women. The study population did not show a decrease in muscle mass with age in either men or women up to an age of 65 years. A comparison of the DBA-calculated muscle mass data with the DXA-derived equations used to estimate the ASM revealed satisfactory results. The IMAT was estimated to constitute up to 20% of the SMM for the investigated candidates characterized by severe obesity. These results, however, should be confirmed in future studies.
Overall, the results suggest that the present model has satisfactory prediction qualities for use as a practical tool in public health care.
Declarations
Acknowledgement
The authors are grateful to Dr. Vera Demond for assistance in anthropometric measurements and bioelectrical impedance analysis. The unconditional participation of patients and nurses is very much appreciated.
Authors’ contributions
ND is responsible for the conception and design of the study, drafted the manuscript and performed statistical analyses, data analysis, illustrations and interpretation. DK is responsible for the conception and design of the study and the measurements of the patients. All authors were engaged in the interpretation and discussion of the data and read and approved the final manuscript.
Funding
This research received no external funding.
Availability of data and materials
All relevant data are within the manuscript and its supporting information files.
Ethics approval and consent to participate
All study procedures were performed according to the ethical standards of the World Medical Association’s Declaration of Helsinki and were approved by the medical ethics committee of the Rheinische-Friedrich-Wilhelm’s-Universität, Bonn, Germany (197/19). Written informed consent was obtained from each patient prior to trial participation.
Consent for publication
Not applicable.
Competing interests
ND is the owner of the website www.dahlmann-body-analysis.de
For scientific work, the system is free of charge.
DK declares no conflict of interest.
Abbreviations
References
- 1.Haines M S, Dichtel L E, Santoso K, Torriani M, Miller K K. (2020) Association between muscle mass and insulin sensitivity independent of detrimental adipose depots in young adults with overweight/obesity. , Int J Obes 44, 1851-8.
- 2.Dahlmann N, Klingmüller D. (2023) A New Anthropometric Model for Body Composition Estimation in the Assessment of Metabolic Risk Factors of Obese Women. https://www.fortunejournals.com/articles/a-new-anthropometric-model-for-body-composition-estimation-in-the-assessment-of-metabolic-risk-factors-of-obese-women.html , Arch Intern Med Res.; 06(02).
- 3.Tomlinson D J, Erskine R M, Morse C I, Winwood K, Onambélé-Pearson G. (2023) The impact of obesity on skeletal muscle strength and structure through adolescence to old age. , Biogerontology 17, 467-83.
- 4.Walowski C O, Braun W, Maisch M J, Jensen B, Peine S. (2020) Reference Values for Skeletal Muscle Mass - Current Concepts and Methodological Considerations. , Nutrients.; 12(3).
- 5.Dahlmann N, Klingmüller D. (2023) The Skeleton Frame as a Crucial Part of Body Weight: Comparison to Metropolitan Life Insurance Data. , Int J Sci Res 12(2).
- 6.Heymsfield S B, Gallagher D, Mayer L, Beetsch J, Pietrobelli. (2007) A. Scaling of human body composition to stature: new insights into body mass index. , Am J Clin Nutr 86, 82-91.
- 7.Dahlmann N, Demond V. (2022) A new anthropometric model for body composition estimation: Comparison with a bioelectrical impedance consumer device. , PLOS ONE 17(9), 0271880-10.
- 8.Abdalla P P, da Silva LSL, ACR Venturini, MFT Júnior, Schneider G. (2023) Anthropometric equations to estimate appendicular muscle mass from dual-energy X-ray absorptiometry (DXA): A scoping review. , Arch Gerontol Geriatr.; 110, 104972-0167494323000511.
- 9.Kim J, Heshka S, Gallagher D, Kotler D P, Mayer L et al. (2004) Intermuscular adipose tissue-free skeletal muscle mass: estimation by dual-energy X-ray absorptiometry in adults. , J Appl Physiol.; 97, 655-60.
- 10.Dahlmann N, Schlegel W, Hölzer K H, Hopfeld G. (1977) A simple method of determining the ideal weight. , Z Morphol Anthropol.; 68, 265-274.
- 11.Xue Q, Li X, Ma H, Wang X, Heianza Y et al. (2024) Ready-to-Eat Food Environments and Risk of Incident Heart Failure: A Prospective Cohort Study. Circ Heart Fail. 17(3), 010830.
- 12.Kulkarni B, Kuper H, Taylor A, Wells J C, Radhakrishna K V. (2013) Development and validation of anthropometric prediction equations for estimation of lean body mass and appendicular lean soft tissue in Indian men and women. , J Appl Physiol 115, 1156-62.
- 13.Tian S, Laurence M, Denis J-B, Morio B. (2013) A multivariate model for predicting segmental body composition. , Br J Nutr 110, 2260-2270.
- 14.Wen X, Wang M, Jiang C M, Zhang Y M. (2011) Anthropometric equation for estimation of appendicular skeletal muscle mass in Chinese adults. , Asia Pac J Clin Nutr 20, 551-6.
- 15.Heymsfield S B, Stanley A, Pietrobelli A, Heo M. (2020) Simple skeletal muscle mass estimation formulas: What we can learn from them. Front Endocrinol. 11(31).
- 16.Goodpaster B H, Park S W, Harris T B, Kritchevsky S B, Nevitt M. (2006) The loss of skeletal muscle strength, mass, and quality in older adults: The health, aging and body composition study. , J Gerontol 61, 1059-64.
- 17.Delmonico M J, Harris T B, Lee J S, Visser M, Nevitt M. (2007) Alternative definitions of sarcopenia, lower extremity performance, and functional impairment with aging in older men and women. , J Am Geriatr Soc 55, 769-74.
- 18.Baumgartner R N, Koehler K M, Gallagher D, Romero L, Heymsfield S B. (1998) Epidemiology of sarcopenia among the elderly in New Mexico. , Am J Epidemiol 147, 755-63.
- 19.Albu J B, Kovera A J, Allen L, Wainwright M, Berk E. (2005) Independent association of insulin resistance with larger amounts of intermuscular adipose tissue and a greater acute insulin response to glucose in African American than in white nondiabetic women. , Am J Clin Nutr 82, 1210-7.
- 20.Leon B, Jenkins S, Pepin K, Chaudhry H, Smith K. (2013) Insulin and extremity muscle mass in overweight and obese women. , Int J Obes.; 37, 1560-4.
- 21.Janssen I, Heymsfield S B, Wang Z, Ross R. (2000) Skeletal muscle mass and distribution in 468 men and women aged 18–88 yr. , J Appl Physiol 89, 81-88.
- 22.Hwaung P, Bosy-Westphal A, Muller M J, Geisler C, Heo M. (2019) Obesity Tissue: Composition, Energy Expenditure, and Energy Content in Adult Humans. Obes Silver Spring Md. 27, 1472-81.