
Racial/Ethnic Differences in Framingham Risk Score in an NHANES Cohort
Abstract
Objective
Studies assessing the risk of developing CVD between different racial groups in the United States have reached varying conclusions. The purpose of this study was to identify risk for CVD using the Framingham Risk Score (FRS) between racial/ethnic groups. A secondary aim of this study was to compare risk for CVD based on SES status/poverty ratio.
Methods
A cross-sectional data analysis was conducted using the 2015-2020 NHANES datasets using individuals aged 18 to 79 years. Sample weights were assigned by NHANES researchers to each participant allowing researchers to generalize results to all non-institutionalized US civilians.
Results
Mexican Americans (MA) had the lowest average FRS and significantly lower CVD risk than all other racial groups, except NH Asian. NH Asians had the second lowest FRS and significantly lower risk than NH Blacks and NH Whites, but their risk was similar to other Hispanic or the other/multi-racial groups. NH Blacks showed no significant difference in FRS compared to NH Whites, other Hispanic, and other/multi-racial groups. NH Whites were not statistically different from other Hispanic or other/multi-racial groups. Other Hispanic and multi-racial groups did not exhibit statistically significant differences. Overall, Mexican Americans had the lowest FRS whereas NH Whites had the highest.
Conclusions
NH whites demonstrated the highest CVD risk according to FRS, as the oldest racial/ethnic group in the cohort. SES did not consistently predict FRS differences between racial/ethnic groups. These findings suggest a need to further explore FRS as a means of identifying individuals who are at high risk of developing CVD.
Author Contributions
Copyright © 2024 Ashley Farokhrouz, et al
 This is an open-access article distributed under the terms of the Creative Commons Attribution License, which permits unrestricted use, distribution, and reproduction in any medium, provided the original author and source are credited.
Competing interests
The authors have declared that no competing interests exist.
Citation:
Introduction
Cardiovascular disease (CVD) is the leading cause of death globally 1, 2 with nearly half (48.6%) of adults in the US over 20 years of age having cardiovascular disease 1. While the prevalence of CVD in the United States has declined in last 4 decades, there has been an increase in the number of CVD deaths per year over a ten year span (2010-2020) 1, 2, 3. An overall decrease in prevalence would intuitively be assumed with a concomitant decrease in death from CVD. Yet, there has been an increase in mortality from CVD with the increase in deaths in the US in1 recent years somewhat explained by disparities in age-adjusted Heart Disease (HD) death rates that have persisted among major racial and ethnic groups in the United States 1, 3, 4.
The prevalence of CVD is associated with a variety of risk factors, including smoking, physical inactivity, arterial hypertension, and obesity 1, 4, 5. While medical risks factors are commonly attributed as the primary drivers of CVD, it is important to acknowledge the less discrete social determinants of health, notably race and ethnicity, which have also been reported to be significant predictors of CVD risk 6, 7.However, research regarding the relationship between race and ethnicity and the prevalence of CVD has reported mixed evidence-based outcomes in previous studies 6, 8, 9.Although differences in the prevalence of CVD risk factors among various racial and ethnic groups have been widely studied, an unequivocal conclusion of the empirical differences between racial groups has not been established 6, 8, 9.
The Framingham Risk Score (FRS) is a widely used tool for estimating the risk of developing CVD. The FRS considers several risk factors such as age, gender, blood pressure, smoking status, and cholesterol levels. The FRS was developed based on data collected from the Framingham Heart Study. Several studies have evaluated the accuracy of the FRS in predicting the risk of developing CVD. A meta-analysis of 26 studies reported that the FRS was moderately accurate in predicting the risk of CVD 5. The accuracy of the FRS was found to be highest in populations where it was originally developed, such as Caucasians in the United States. The FRS was less accurate in predicting the risk of CVD in other populations, such as Asians and Africans6.
In a study analyzing the 10-year risk of CVD in Black and White individuals, Black individuals with similar risk profiles, analyzed by FRS, were more likely to be associated with CVD versus their White counterparts 8. Both Black men and women had greater risk associated with 10-year cardiovascular disease compared to White men and women with identical risk profiles 8. A similar study using FRS to determine risk of CVD events in various racial and ethnic groups found that FRS factors for CVD events were consistent among race/ethnic groups 9. Nevertheless, the strength of the correlations between different risk factors and CVD events varied significantly across the race/ethnic groups.
Additionally, the differences in correlations between CVD in different ethnic groups may be in relation to Socio Economic Status (SES). Factors that influence SES have been deemed notable indicators of CVD risk 4, 10, 11. Socioeconomic factors such as low education level and low household income have been consistently associated with higher CVD risk 12, 13, 14, 15, 16, 17. Evaluation of an individual’s Framingham Risk Score has long been a reliable and standard method of analyzing the susceptibility of presenting with CVD and continues to be used as a measurement of the risk of developing heart disease 18, 19.
Within various racial and ethnic groups, studies of the relationship between SES, CVD risk, and FRS, specifically, have not been widely evaluated. Studies that have investigated the relationship between race and ethnicity, FRS, and SES have reached varying conclusions 20, 21. Because study outcomes regarding the overall prevalence of risk factors for CVD in various racial and ethnic groups have inconclusive findings, our study evaluated these differences in racial groups as identified by US Census racial categories and their FRS while controlling for a common psychosocial influence of socio economic status. Therefore, the major objective of this study was to explore the consistency of the FRS in identifying risk for CVD between racial/ethnic groups. A secondary objective of this study was to compare risk for CVD based on SES status.
Materials and Methods
Data for the present study were acquired from the United States (US) Centers for Disease Control and Prevention (CDC) website 22 as part of the 2015-2016 and 2017-2020 National Health and Nutrition Examination Survey (NHANES) cycles. Data from the two NHANES cycles utilized were gathered prior to the COVID-19 pandemic. This study was determined to be exempt from IRB review by the sponsoring university due to the nature of the secondary data analysis (IRB ID# 1505514-1).
Study Sample
NHANES data are collected using a complex, four-stage, probability sampling design in which the US is divided into counties (stage 1), counties are divided into census blocks (stage 2), households are identified within census blocks (stage 3), and individuals from each household are chosen for the study (stage 4). This sampling design selects individuals so that the sample is representative of civilian, non-institutionalized US citizens. Oversampling of minorities and sub-groups is done to increase the reliability and precision of the sample taken. Unique sample weights are assigned to all subjects in the dataset so that the known probability of selection, non-responders, and variations in the sample are accounted for, ensuring that the sample is representative of the greater US population. This involves weighting certain characteristics such a race/ethnicity, age etc. to ensure the sample is a representation of a larger population making sure that more inferences can be made from the sample. This weighting technique allows for a convenience sample to be more representative of a larger population, in this instance, a larger US population. Using this technique, a single individual is representative of a larger group of individuals, and therefore data can be extrapolated to the entire US population.
The original study sample included 25,531 individuals. Subjects were not included in the analysis if they participated in dialysis treatment in the 12 months prior to the study (n=59), were pregnant at the time of the study (n=157), were younger than 18 or older than 79 (n=10,896), were missing all information pertinent to their cardiometabolic profile (n=2,632), were missing information pertinent to their socioeconomic status (SES, n=1,342), and/or if they were missing information for sample weighting or were not included in the fasting subsample (n= 5,624). This resulted in a final sample size of 4,821 individuals who were representative of 198,781,963 Americans when utilizing survey sample weights. The survey sample weights used were appropriate for the subsample of individuals who were reportedly fasting during the laboratory procedures. The two survey cycles were appropriately weighted for their relative contributions according to the NHANES analytical guidelines; two years’ data were attributable to the 2015-2016 sample and 3.2 years’ data were attributable to the 2017-2020 sample.
Demographics and Variables
The analytic guidelines and procedure documents for each examination, questionnaire, and/or laboratory test can be found on the CDC website 23. Race/ethnicity was self-reported by study participants in the following categories: Mexican American, other Hispanic, Non-Hispanic (NH) White, NH black, NH Asian, and other NH races/ethnicities including other/multi-racial. Those who self-reported as Mexican American were coded as such irrespective of other race/ethnicities. Those who self-reported as Hispanic but not Mexican American were coded as “other Hispanic”. SES was reported as a ratio of family income to poverty level. Each family’s annual income was divided by the annual poverty level set by the Department of Health and Human Services (HHS). Values ranged from 0 to 5.00 and all values above 5.00 were coded as 5.00 for deidentification purposes. For example, if the poverty level for a given year was $20,000, and a study participant reported that their family income was $60,000 that year, their poverty ratio would be 3.0. If they made $20,000, it would be 1.0, and if they made $100,000, it would be 5.0. The 10-year Framingham risk score (FRS) was calculated using the coefficients published in the 2008 paper by D’Agostino et al 24 and the following equations were found at www.framinghamheartstudy.org25:
Female: 1-0.95012exp(ΣßX – 26.1931)
Male: 1-0.88936exp(ΣßX – 23.9802)
where ß is the regression coefficient and X is the level for each risk factor. Caloric intake was averaged over two days’ time using the Continuing Survey of Food Intakes by Individuals (CSFII). The CSFII is a nationwide survey conducted by USDA’s Agricultural Research Service. Renal function was calculated by the CKD-EPI equation 26. Regular physical activity (PA) was defined as 75 minutes per week of vigorous-intensity PA, 150 minutes per week of moderate-intensity PA, or an equivalent combination of both 27, 28. Subjects were considered smokers if they reported smoking more than 100 cigarettes in their entire life, if they reported tobacco use within the 5 days prior to the study, or if they used cigarettes “every day” or “some days”. Prescription medications for hypertension and diabetes were determined using the International Classification of Diseases, Tenth revision (ICD-10) codes. Medications for hypertension included any medication used to treat hypertension (codes I10 and I10.P) and medications for diabetes included any medication used to treat hyperglycemia (codes R73, E11, E11.2, E11.2P, E11.4, and E11.P). Diabetes was defined using the American Diabetes Association (ADA) criteria for fasting glucose ³ 126 mg/dL. Additionally, participants who were taking a prescription drug for hyperglycemia were defined as diabetic. Metabolic syndrome (MetS) was defined using the 2009 harmonized definition by Alberti et al 29.
Statistical Analyses
The normality of the data was tested using measures of skewness/kurtosis, histograms, P-P plots, and Q-Q plots. Unweighted data were reported as mean and standard deviation (SD) in the case of continuous variables or as frequency and percentage (%) of the total for categorical variables. Weighted data were reported as mean and standard error (SE) in the case of continuous variables or as %, SE in the case of categorical variables. Variables with large amounts of missingness were reported in the footnote of Table 1. Survey sample weights were utilized for comparisons between racial/ethnic groups and for all statistical analyses. A “domain” statement, rather than listwise deletion, was used in statistical analyses to incorporate individuals who met the inclusion criteria and to ensure the accuracy of standard error values and the number of elements in the sample. Differences in values between race/ethnicity were tested using Rao-Scott and/or Pearson’s chi square (χ2) tests for categorical variables and weighted logistic regression was used in post-hoc testing to make race-to-race comparisons. Continuous variables were tested for differences between racial/ethnic groups using weighted analysis of variance (ANOVA) with post-hoc testing for pairwise comparisons using least squares means. Analysis of covariance (ANCOVA) was investigated by researchers for the main analysis, but the assumptions for the independence of the covariate and treatment effect as well as the homogeneity of regression slopes were violated. All statistical tests were considered significant at the α < 0.05 level. Additionally, all analyses utilized survey sample weighting unless otherwise noted. Statistical analyses were conducted in SAS version 9.4 (SAS Institute Inc., Cary, NC, USA).
Results
After all inclusion and exclusion criteria were considered, the sample size consisted of 4,821 non-institutionalized US citizens who were representative of 198,781,963 US adults (Table 1). The weighted sample was 49.6% male, and the mean age of the sample was 45.92 years. The average income (poverty ratio) was 3.07 times the poverty level for the years included, and the mean Framingham 10-year cardiovascular disease risk score was 8.92%. LDL-cholesterol, fasting blood glucose, and systolic blood pressures were high in the sample (111.06 mg/dL, 109.15 mg/dL, and 120.97 mmHg, respectively), while HDL, total cholesterol, triglycerides, and diastolic blood pressures were normal (54.30 mg/dL, 187.37 mg/dL, 111.26 mg/dL, and 72.26 mmHg). The average body mass index was classified as overweight (29.64 kg/m2) and high-sensitivity C-reactive protein was slightly elevated (3.82 mg/L). Nearly half of the sample had metabolic syndrome (42.53%), one quarter were on medication for high blood pressure (22.55%), and 17.39% reported smoking.
Table 1. The unweighted total included the total sample (n=4,821) where continuous variables are reported as mean (SD) and categorical variables are reported as n (%). The weighted total utilizes complex survey sample weighting such that the sample is representative of 198,781,963 US citizens. Continuous variables are reported as mean (SE) and categorical variables are represented as % (SE). ANOVA was conducted for differences between continuous variables for each race and chi square tests were conducted for differences between categorical variables. There is 50% missingness in PA variable and 4.4% missingness in caloric intake. Abbreviations: HDL, high-density lipoprotein cholesterol; LDL, low-density lipoprotein cholesterol; BMI, body mass index; CKDEPI eGFR, Chronic Kidney Disease Epidemiology Collaboration- estimated glomerular filtration rate; HS-CRP, high-sensitivity C-reactive protein; PA, physical activity.| Race, % (SE) | |||||||||
| Unweighted Total ( n = 4,821) | Weighted Total ( n =198,781,963) | NH White (64.22%) | Mexican American (8.70%) | Other Hispanic (6.52%) | NH Black (10.84%) | NH Asian (5.37%) | Other/ Multi-Racial (4.35%) | p-value | |
| Age (years) | 47.32 (16.85) | 45.92 (0.53) | 47.81 (0.73) | 39.13 (1.17) | 43.69 (0.95) | 43.58 (0.58) | 44.35 (0.78) | 42.79 (1.50) | <.0001 |
| Male Sex | 2377 (49.31) | 49.60 (0.90) | 49.91 (1.31) | 53.87 (1.84) | 47.38 (2.51) | 44.51 (1.40) | 49.60 (1.78) | 52.56 (4.23) | 0.0366 |
| Poverty Ratio | 2.55 (1.63) | 3.07 (0.06) | 3.44 (0.06) | 2.00 (0.11) | 2.36 (0.10) | 2.30 (0.09) | 3.32 (0.14) | 2.51 (0.18) | <.0001 |
| Framingham Risk Score | 10.62 (12.77) | 8.92 (0.30) | 9.41 (0.40) | 6.64 (0.55) | 8.25 (0.59) | 8.86 (0.47) | 7.56 (0.35) | 9.05 (1.02) | 0.0002 |
| Total Cholesterol (mg/dL) | 185.84 (41.53) | 187.37 (1.09) | 188.78 (1.44) | 183.19 (1.92) | 185.54 (2.66) | 181.34 (1.92) | 190.55 (2.34) | 188.78 (2.95) | 0.015 |
| HDL (mg/dL) | 53.75 (16.14) | 54.30 (0.44) | 54.94 (0.56) | 49.81 (0.79) | 51.89 (0.73) | 56.56 (0.59) | 55.71 (0.86) | 50.12 (0.99) | <.0001 |
| LDL (mg/dL) | 110.45 (35.90) | 111.06 (0.88) | 111.32 (1.20) | 109.32 (1.74) | 111.59 (2.00) | 108.29 (1.79) | 112.64 (1.90) | 114.91 (2.71) | 0.201 |
| Systolic Blood Pressure (mmHg) | 122.98 (17.77) | 120.97 (0.33) | 120.61 (0.44) | 119.40 (0.80) | 120.22 (0.93) | 125.67 (0.98) | 119.79 (0.74) | 120.36 (1.64) | <.0001 |
| Diastolic Blood Pressure (mmHg) | 72.42 (11.89) | 72.26 (0.27) | 72.06 (0.34) | 71.21 (0.55) | 70.83 (0.98) | 74.64 (0.59) | 72.81 (0.53) | 72.95 (0.85) | <.0001 |
| Fasting Glucose (mg/dL) | 112.61 (38.64) | 109.15 (0.68) | 108.35 (1.03) | 114.01 (1.72) | 110.50 (1.43) | 109.21 (0.96) | 107.66 (1.23) | 110.93 (2.47) | 0.0804 |
| BMI (kg/m 2 ) | 29.77 (7.43) | 29.64 (0.17) | 29.58 (0.23) | 30.65 (0.26) | 29.78 (0.38) | 31.09 (0.36) | 25.30 (0.25) | 30.14 (0.67) | <.0001 |
| Waist Circumference (cm) | 100.21 (17.49) | 100.29 (0.46) | 101.18 (0.60) | 100.71 (0.58) | 98.67 (0.98) | 100.85 (0.68) | 88.78 (0.59) | 101.64 (1.50) | <.0001 |
| Caloric intake (Kcal/day) | 2050 (850) | 2099 (16) | 2119 (20) | 2210 (48) | 1949(35) | 2051 (40) | 1921 (40) | 2112 (74) | <.0001 |
| Triglycerides (mg/dL) | 110.07 (94.10) | 111.26 (1.93) | 112.87 (2.53) | 123.15 (5.17) | 117.12 (7.65) | 82.80 (2.53) | 114.38 (3.98) | 121.88 (7.06) | <.0001 |
| CKDEPI eGFR (ml/min/1.73m 2 ) | 98.23 (22.08) | 97.60 (0.66) | 93.75 (0.76) | 109.92 (1.53) | 102.11 (1.01) | 105.69 (0.78) | 102.72 (0.89) | 96.50 (1.87) | <.0001 |
| HS-CRP (mg/L) | 4.12 (8.01) | 3.82 (0.15) | 3.70 (0.20) | 4.00 (0.35) | 4.49 (0.42) | 4.84 (0.30) | 1.98 (0.15) | 3.99 (0.41) | <.0001 |
| Physical Activity (meets req.)* | 1688 (69.90) | 70.13 (1.36) | 68.46 (1.90) | 77.52 (2.70) | 73.88 (4.16) | 73.11 (1.91) | 66.86 (3.36) | 76.28 (5.35) | 0.0525 |
| Current Smoker | 921 (19.10) | 17.39 (0.90) | 16.38 (1.20) | 15.57 (1.65) | 15.31 (1.81) | 22.88 (1.48) | 9.38 (1.33) | 35.22 (4.30) | <.0001 |
| Hypertension Prescription | 1274 (26.43) | 22.55 (1.14) | 23.52 (1.64) | 12.54 (1.56) | 17.29 (1.84) | 28.55 (1.64) | 19.43 (1.93) | 25.09 (3.90) | <.0001 |
| Diabetic | 892 (18.50) | 14.22 (0.72) | 13.57 (1.05) | 16.34 (2.01) | 14.70 (1.68) | 16.99 (1.04) | 12.96 (1.38) | 13.53 (2.39) | 0.231 |
| Metabolic Syndrome | 2148 (45.54) | 42.53 (1.28) | 44.07 (1.85) | 40.15 (2.18) | 38.15 (2.36) | 37.18 (1.87) | 40.55 (2.76) | 46.83 (4.32) | 0.0285 |
Analyses by race/ethnicity were completed to compare the demographic variables. All races/ethnicities had statistically equivalent LDL-cholesterol, fasting blood glucose levels, and reported similar levels of physical activity. Additionally, all races/ethnicities were equivalent in frequency of diabetes. All other demographic variables indicated a significant difference by race/ethnicity.
In the main analysis of variance (ANOVA) tests, FRS and SES were compared by race/ethnicity among 4,821 subjects, who were representative of 198,781,963 Americans. The model R2 was 0.0059 (Root MSE=11.15, DF=40) and FRS was found to be significantly different between races/ethnicities (DF=5, F=6.44, p=0.0002). Mexican Americans had the lowest FRS on average (Table 2) and post-hoc testing revealed that Mexican Americans had a significantly lower FRS compared to all other racial/ethnic groups except NH Asian (Table 3 and Figure 1). NH Asians had the second lowest FRS and had significantly lower risk than NH Blacks and NH Whites, but their FRS was not statistically different from other Hispanic or the other/multi-racial groups. NH Blacks were found to be statistically equivalent to NH White, other Hispanic, and other/multi-racial/ethnic groups in FRS. NH Whites were not statistically different from other Hispanic or other/multi-racial/ethnic groups. Lastly, other Hispanic and multi-racial/ethnic were not found to be statistically different. Overall, Mexican Americans had the lowest FRS whereas NH Whites had the highest.
Table 2. FRS scores comparisons by race/ethnicity among research participants.| Race | FRS | SE | DF | t Value | Pr > |t| |
| Mexican American | 6.6362 | 0.5511 | 40 | 12.04 | <.0001 |
| NH Asian | 7.5615 | 0.346 | 40 | 21.85 | <.0001 |
| NH Black | 8.8572 | 0.4716 | 40 | 18.78 | <.0001 |
| NH White | 9.4091 | 0.3969 | 40 | 23.7 | <.0001 |
| Other Hispanic | 8.2547 | 0.5874 | 40 | 14.05 | <.0001 |
| Other/Multi-Racial | 9.0525 | 1.0232 | 40 | 8.85 | <.0001 |
| Race | Comparison Race | Estimate | Standard Error | DF | t Value | Pr > |t| |
| Mexican American | NH Asian | -0.9253 | 0.6053 | 40 | -1.53 | 0.1343 |
| Mexican American | NH Black | -2.221 | 0.6636 | 40 | -3.35 | 0.0018 |
| Mexican American | NH White | -2.7729 | 0.6418 | 40 | -4.32 | 0.0001 |
| Mexican American | Other Hispanic | -1.6186 | 0.7381 | 40 | -2.19 | 0.0342 |
| Mexican American | Other/Multi-Racial | -2.4163 | 1.0657 | 40 | -2.27 | 0.0289 |
| NH Asian | NH Black | -1.2957 | 0.4605 | 40 | -2.81 | 0.0076 |
| NH Asian | NH White | -1.8477 | 0.4742 | 40 | -3.9 | 0.0004 |
| NH Asian | Other Hispanic | -0.6933 | 0.6518 | 40 | -1.06 | 0.2938 |
| NH Asian | Other/Multi-Racial | -1.491 | 0.9974 | 40 | -1.49 | 0.1428 |
| NH Black | NH White | -0.552 | 0.5457 | 40 | -1.01 | 0.3179 |
| NH Black | Other Hispanic | 0.6024 | 0.6843 | 40 | 0.88 | 0.384 |
| NH Black | Other/Multi-Racial | -0.1953 | 1.0511 | 40 | -0.19 | 0.8535 |
| NH White | Other Hispanic | 1.1544 | 0.7663 | 40 | 1.51 | 0.1398 |
| NH White | Other/Multi-Racial | 0.3566 | 1.0827 | 40 | 0.33 | 0.7436 |
| Other Hispanic | Other/Multi-Racial | -0.7977 | 1.1173 | 40 | -0.71 | 0.4794 |
Figure 1.Visual representation of post-hoc testing- FRS comparisons for race.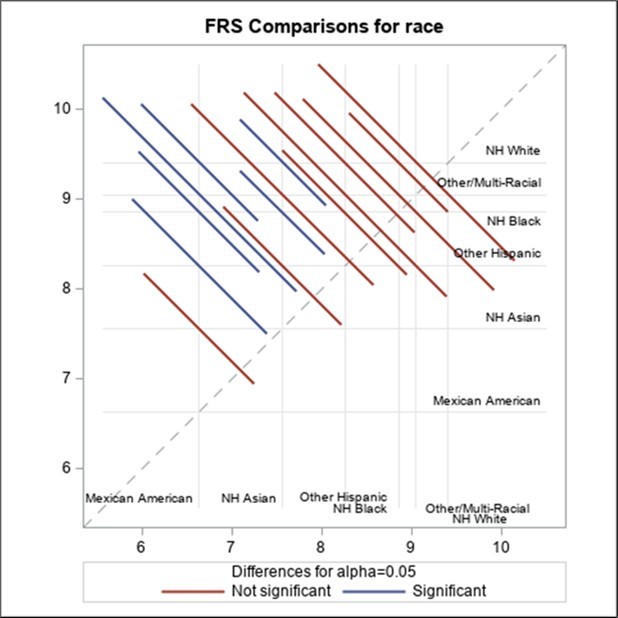
The poverty ratio was also compared among the 6 race categories using the same sample as above. The poverty ratio was statistically different between races (DF=5, F=65.22, <0.0001). NH Asians and NH Whites had the highest poverty ratio, and the ANOVA (R2=0.112, Root MSE=1.556, DF=40) revealed that the poverty ratio was statistically equivalent between NH Asians and NH Whites. The poverty ratio was lower in NH Black, other Hispanic, and other/multi-racial/ethnic groups, and these three groups were not statistically different from one another. Mexican Americans were found to have the lowest poverty ratio and had a significantly lower SES compared to all other races/ethnicities. In additional post-hoc testing, we analyzed each component of the FRS calculation and whether it differed by race/ethnicity (Table 4).
Table 4. Association between FRS scores and race, adjusted for poverty ratio and education (multiple regression)| Predictor Variable | Coefficient | St. Error | t-value | Pr(>|t|) |
| Intercept | 20.9354 | 0.765 | 27.675 | < 2e-16 |
| Race | -0.4413 | 0.1438 | -3.070 | 0.00215 |
| Education | -2.1895 | 0.2159 | -10.143 | < 2e-16 |
| Poverty Ratio | 0.4130 | 0.1609 | 2.567 | 0.01030 |
This finding was further supported by a regression analysis including FRS as the dependent variable poverty ratio as independent variables. The p-value was insignificant (p=0.2029) and only 0.03% of the variance in FRS could be explained by the poverty ratio,
A multiple regression analysis was conducted to analyze the effects of poverty ratio and education on the FRS differences among the 6 different races and is reported in Table 4. The p-value (>0.001) suggests overall model significance. Only about 2.55 % of the variance in FRS scores between the races can be explained by race and education levels (adjusted R2= 0.02549). Although the FRS difference between the races changed from 0.000181 to 0.00215, it was still statistically significant. The independent p-values for the effect of FRS difference due to poverty ratio was 0.0103 and that due to the education level was less than 0.0001.
A Rao-Scott chi squared test indicated a significant difference between sexes by race (χ2=11.87, DF=5, p=0.0366). The logistic regression analysis used for post-hoc testing (with NH Whites as the reference group) indicated that there were a significantly greater number of females than males in the NH Black group (OR=1.24, 95%CI=1.07, 1.44, p=0.0045) as compared to the reference group, NH white. All other races/ethnicities were not statistically different than whites in terms of sex distribution.
A Rao-Scott chi squared test indicated that there was a significant difference in smoking status (χ2=71.95, DF=5, p<0.0001) by race/ethnicity. NH Black and other/multi racial/ethnic groups were more likely to smoke (OR=1.51, 95%CI=1.20, 1.92, p=0.001 and OR=2.78, 95%CI=1.84, 4.19, p<0.0001, respectively) compared to the NH white reference group. NH Asians were less likely to smoke (OR=0.53, 95%CI=0.37, 0.75, p=0.0007) compared to the reference group. Mexican and other Hispanic were not statistically different than NH whites in terms of smoking status.
A Pearson’s chi-squared test indicated a significant overall difference (χ2=37.94, DF=5, p<0.0001) in those taking medication for hypertension. Logistic regression analysis indicated that Mexican Americans and other Hispanics were less likely to be on an HTN med (OR=0.466, 95%CI=0.33, 0.66, p<0.0001 and OR=0.68, 95%CI=0.50, 0.93, p=0.0156, respectively) compared to NH White. NH Blacks were more likely to be on medications for HTN (OR=1.30, 95%CI=1.02, 1.66, p=0.0349) compared to white, and NH Asian and other/multi-racial were not statistically different than NH White in terms of HTN medication use.
A Pearson’s chi-square test was non-significant (χ2=6.86, DF=5, p=0.231) for diabetes status among the racial/ethnic groups. In logistic regression analysis, NH Black was significantly more likely to have diabetes (OR=1.304, 95%CI=1.06, 1.60, p=0.0134) compared to referent group, NH white. No other racial/ethnic groups were statistically different from the reference.
An ANOVA demonstrated that there was a significant effect of race/ethnic (p<.0001) when comparing age in the 6 race/ethnic categories. Adults 18 to 79 years of age were included in the analysis. On average, Mexican Americans were the youngest and NH Whites were oldest. Post-hoc testing demonstrated that Mexican Americans were younger, on average, compared to NH Asians (t=-3.78, p=0.0005), NH Blacks (t=-3.47, p=0.0013), NH Whites (t=-6.32, p<.0001), and other Hispanics (t=-3.43, p=0.0014). NH Whites were older, on average, than all other races/ethnicities: Mexican Americans (t=-6.32, p<.0001), NH Asians (t=-3.28, p=0.0021), NH Blacks (t=-4.67, p<.0001), other Hispanics (t=3.11, p=0.0034), and other/multi-racial (t=3.54, p=0.001).
An ANOVA demonstrated that there was a significant effect of race/ethnicity (p=0.015) when comparing total cholesterol in the 6 race categories. Overall, NH Blacks had the lowest total cholesterol, followed by Mexican Americans. NH Asians had the highest total cholesterol, followed by NH Whites and Other/Multi Racial. Post-hoc testing demonstrated that Mexican Americans had lower total cholesterol than NH Asians (t=-2.46, p=0.0185) and NH Whites (t=-2.46, p=0.0185). NH Blacks had significantly lower total cholesterol than NH Asians (t=2.86, p=0.0066), NH Whites (t=-3.35, p=0.0018), and other/multi-Racial (t=-2.28, p=0.0283) groups.
An ANOVA demonstrated that there was a significant effect of race (p<.0001) when comparing HDL-cholesterol among the 6 race/ethnicity categories. Overall, NH Blacks had the highest HDL followed by NH Asians, whereas Mexican Americans had the lowest HDL, followed by Other/Multi Racial. Post-hoc testing demonstrated that Mexican Americans had significantly lower HDL than NH Asians (t=-6.61, p<.0001), NH Blacks (t=-6.43, p<.0001), and NH Whites (t=-5.33, p<.0001). The other/multi racial/ethnic group had significantly lower HDL than NH Asians (t=4.56, p<.0001), NH Blacks (t=6.34, p<.0001), and NH Whites (t=4.6, p<.0001). NH Blacks had significantly higher HDL than NH Whites (t=2.2, p=0.0339), other Hispanics (t=5.36, p<.0001), and Other/Multi-Racial (t=6.34, p<.0001). NH Asians had significantly higher HDL than Other Hispanics (t=3.48, p=0.0012), and NH Whites had significantly higher HDL than Other Hispanics (t=3.39, p=0.0016). Mexican Americans, Other Hispanics and Other/Multi-Racial were not significantly different from one another in terms of HDL-cholesterol and NH Asians were found to be statistically similar to NH Blacks and NH Whites.
There was a significant difference in systolic blood pressure (SBP) by race (p<.0001). Overall, NH Blacks had the highest SBP (125.67, SE=0.98 mmHg) and Mexican Americans had the lowest (119.4, SE=0.80 mmHg) followed closely by NH Asians (119.79, SE=0.74 mmHg). Post hoc testing demonstrated that NH Blacks had significantly higher SBP compared to all other races: Mexican American (MA) (t=-4.67, p<.0001), NH Asian (t=-5.36, p<.0001), NH White (t=5.21, p<.0001, Other Hispanic (t=4.76, p<.0001), and Other/Multi-Racial (t=2.83, p=0.0072). No other significant relationships were found.
Discussion
Racial/ethnic differences in CVD have been previously published in the literature with many studies using FRS as means to measure risk for disease. Previous studies have demonstrated equivocal findings by comparing racial/ethnic differences in CVD using the FRS 20, 21. Our study, using NHANES data, discovered racial differences in a large cohort of participants in FRS outcomes. MA had the lowest FRS, followed by NH Asians, while NH Blacks and NH Whites had the highest FRS, thus supporting some previous studies. 30, 31, 32, 33 while not supporting others 34. The FRS was originally developed based on a predominantly NH White population, which raises concern about its accuracy in predicting cardiovascular disease risk for other racial/ethnic groups. Our study suggests that the FRS may overestimate or underestimate risk for certain racial/ethnic groups.
Age-Adjusted death rates from 2019 provided by the National Center for Health Statistics22 (NCHS), listed in descending order with the highest death rate in NH Blacks, followed by NH Whites, Hispanic and finally NH Asian. Though the rankings in FRS in our study and age-adjusted death rates by NCHS were slightly different, both were similar in that the NCHS death rates were higher in the racial groups with higher FRS scores (NH Blacks and NH Whites) and lower in groups with the lowest FRS scores (MA and NH Asians).
In comparing racial/ethnic differences in FRS, there was a need to ascertain SES to discover if racial/ethnic differences could be related to the poverty ratio. Our study findings report that the poverty ratio was highest in NH Whites and NH Asians, with both of those groups having the highest (NH Whites) and second lowest (NH Asians) FRS scores. The MA group had the lowest poverty ratio, but the lowest FRS score. Previous literature 35 has suggested that the poverty ratio can predict FRS, but it should be noted in our study that the highest poverty ratio group had the greatest FRS, and the lowest poverty ratio group had the lowest, and theoretically less CVD risk based on the lowest FRS. These findings suggest that the poverty ratio may not be helpful in predicting differences in FRS between racial/ethnic groups.
When comparing FRS between racial/ethnic groups, there were several counterintuitive findings from our study. First, the highest FRS was in NH Whites. It should be noted that NH Whites were also the oldest group of participants who averaged 47 years of age, suggesting that age may have played role in the FRS differences. Also, the lowest FRS group was MA which were the youngest racial/ethnic group in our study who averaged 39 years of age, supporting the possibility that age, which is unequivocal in literature 36, is a predictor of CVD and affected the outcomes of this study, considering that age is a part of the FRS calculation.
Another consideration for the findings of lowest FRS in MA may be explained by what has been termed the Hispanic Paradox or Hispanic Epidemiological Paradox. This paradox was first reported by Markides and Eschbach and later by 37 Markides and Coreil.38 The term Hispanic paradox was later introduced in 2005 in the scientific literature39. Most recently this paradox suggests that Hispanics in the United States, though having higher poverty indexes than other racial counterparts, having lower levels of CVD40. Reasons that have been offered include lower infant mortality rates41, immigrants returning to their country of origin to die, known as the “salmon effect”42 and cultural and lifestyle differences40. Our study supports what is called the Hispanic paradox in that the lowest risk, when using FRS, is associated with MA, even though they scored lowest on the poverty index in our study. Finally, measurement bias43 is another factor identified in the Hispanic paradox, and using the NHANES database could have measurement bias, yet, the size of the database could help to reduce the bias associated with self-reported data.
NH Blacks had both the highest HDL (a risk factor used in FRS calculations) and lowest total cholesterol levels (also used in FRS risk calculations) between racial/ethnic groups. Normally elevated HDL levels can be associated with decreased risk of CVD and can be partially responsible for a lower FRS score when compared to NH Whites and other multiracial groups. Yet, there is emerging evidence that dysfunctional HDL 44, 45 may cause HDL to not participate in reverse cholesterol transport. This dysfunction is associated with higher levels of total and LDL cholesterol; however, our study does not provide support for these associations as the best cholesterol profile was discovered in NH Blacks, and the highest risk based on cholesterol values, was in MA. Yet, the corresponding FRS scores suggested the second highest FRS was in NH Blacks and the lowest FRS in MA, which are counterintuitive based on cholesterol values. Again, this may be due to differences in age between these groups as MA was the youngest racial/ethnic group. Age combined with a hypothesis of HDL dysfunction, could suggest that FRS may not be as predictive as previously reported. Though differences in cholesterol values were statistically significant, the differences were not clinically significant between most racial/ethnic groups.
It should be noted that counter to previous studies 46, 47, 48, 49 systolic blood pressure was statistically significantly higher (though not clinically different) in NH Blacks compared to all other racial/ethnic groups. Previous literature has reported differences between racial/ethnic groups 50 with previous studies suggesting the high risk in NH Blacks, followed by Hispanics, Asian and Caucasians 51. Our study does not support these findings suggesting that systolic blood pressure did not contribute to the FRS. Additionally, it is worth noting that the clinical differences between racial/ethnic groups were not meaningful.
Finally, NH Blacks recorded the second highest smoking levels with other/multi-racial having the highest compared to other racial/ethnic groups, which normally is associated with increased FRS 45 but is not supported by our findings. This increased risk based on smoking status, combined with the lowest cholesterol levels in NH Blacks, makes for a challenging interpretation of FRS. It should be noted that when comparing sex differences between racial/ethnic groups, NH Blacks had a higher percentage of females when compared to other racial/ethnic groups.
Many of the counterintuitive findings, though not a focus of our study, may be due to shortcomings that have been identified in the literature regarding FRS 50. FRS was developed based on data collected from a predominantly Caucasian population in the United States. As a result, the accuracy of FRS in predicting the risk of CVD in other populations may be limited 28. Second, the FRS does not consider several risk factors that have since been identified as important in the development of CVD, such as family history, diabetes, chronic kidney disease and obesity 29. Third, the FRS only predicts the risk of developing CVD over a 10-year period and does not consider the lifetime risk of developing CVD 30.
Despite its limitations, the FRS has been widely used in clinical practice to assess a patient's risk of developing CVD. The FRS can help clinicians identify patients who are at high risk of developing CVD and can guide the implementation of interventions to reduce this risk 31. Interventions may include lifestyle modifications such as dietary changes and exercise, as well as pharmacological interventions such as statins 32. The FRS can also be used to monitor changes in a patient's risk of developing CVD over time and to guide the implementation of additional interventions as needed 33.
Based on these findings, the FRS could be improved to make it more inclusive for diverse populations. A comprehensive update should integrate race/ethnicity-specific variables and socioeconomic factors that more accurately reflect cardiovascular risk in non-NH White populations. The current FRS does not explicitly account for the significant differences in cardiovascular risk across racial and ethnic groups. Our findings show that Mexican Americans and NH Asians have lower FRS scores while NH Blacks and NH Whites have higher scores. However, these results do not align fully with CVD outcomes or other risk factors like cholesterol levels. Incorporating race/ethnicity into the FRS calculation would adjust for these disparities, possibly aligning the score more closely with the actual CVD risk for each group
Our study also reveals a disconnect between poverty ratio and FRS outcomes across different racial/ethnic groups. For instance, Mexican Americans had the lowest poverty ratio but also the lowest FRS, contradicting previous assumptions about the link between SES and cardiovascular risk. Updating the FRS to include SES as a weighted factor may help better capture the effects of socioeconomic stress, access to healthcare, and lifestyle factors on cardiovascular risk. This adjustment would be especially beneficial for underserved populations, where SES plays a major role in health outcomes.
Several limitations occurred in our study. Data were collected cross-sectionally at single time points through multiple NHANES cohorts limiting the ability to make causal inferences. Some data in NHANES are self-reported which is subject to under and overreporting of certain variables. The NHANES data may be subject to selection biases, including nonresponse from individuals who did not provide data, potentially affecting the representativeness of the sample. The effect of adult health on poverty ratios may also introduce bias in the analysis, as one’s health status can influence healthcare costs and financial stability 46. The large sample and the sample weighting technique helps overcome information bias from self-reported data, making findings from the study of importance while yielding generalizable results.
Future studies could also include a focus on critical gene expression that may be suppressed in various racial groups. For instance, Sirtuin 1 (SIRT1) is a NAD+-dependent deacetylase that plays a crucial role in cellular regulation, influencing processes such as metabolism, inflammation, and apoptosis. Its expression is found in various tissues, including the cardiovascular system, where it modulates endothelial function and smooth muscle cell behavior.53 SIRT1 has emerged as a significant modulator of several metabolic pathways that align closely with the FRS risk factors, which include hypertension, hyperlipidemia, diabetes, and smoking.54 SIRT1 is known to influence lipid metabolism and glucose homeostasis, effectively regulating the pathways that govern insulin sensitivity and cholesterol levels. By enhancing the activity of key enzymes involved in lipid oxidation and glucose metabolism, SIRT1 plays a protective role against the metabolic dysregulation associated with these risk factors.53, 55 Consequently, alterations in SIRT1 expression or activity could directly impact an individual's FRS profile, highlighting its potential as a biomarker for assessing cardiovascular risk. Inclusion of SIRTI levels in clinical practice as a predictor for CVD could help enhance clinical approaches to reduce the risk of disease outcomes.53
Conclusion
Our analysis revealed that NH whites demonstrated the highest CVD risk according to FRS and were the oldest racial/ethnic group in the cohort, while the racial/ethnic group with the lowest risk for CVD based on FRS is in MA, followed by the next highest of NH Asians, then NH Blacks, and other/multiracial. SES did not consistently predict FRS differences between racial/ethnic groups.
These findings underscore the complexity of CVD risk factors and their relationship with race and ethnicity. Moving forward, future research should focus on the mechanisms, aside from SES, which may drive these disparities such as genetic factors, lifestyle choices, and access to healthcare. Additionally, there is a great need to refine and enhance risk assessment tools such as FRS to accurately identify individuals who are at greater risk of developing CVD, especially within various racial/ethnic groups. This type of research will play a significant role in developing interventions to reduce CVD disparities among racial/ethnic groups.
Funding
The Brown Foundation, Baylor University, provide funding for Post-Doctoral Fellowship support
Dataset availability
Data for this study was collected and is available through National Health and Nutrition Examination Survey (https://www.cdc.gov/nchs/nhanes/index.html) database.
References
- 1.Tsao C W, Aday A W, Almarzooq Z I. (2023) . Heart Disease and Stroke Statistics-2023 Update: A Report From the American Heart Association.Circulation 147(8), 93-621.
- 2.Ahmad F B, Anderson R N. (2021) . The Leading Causes of Death in the US for 2020.JAMA 325(18), 1829-1830.
- 3.Shah N S, Lloyd-Jones D M, O’Flaherty M. (2019) . Trends in Cardiometabolic Mortality in the United States 322(8), 780-10.
- 4.He J, Zhu Z, Bundy J D, Dorans K S, Chen J et al. (2021) . Trends in Cardiovascular Risk Factors in US Adults by Race and Ethnicity and Socioeconomic Status 326(13), 1286-10.
- 5.Francula-Zaninovic S, Nola I A. (2018) . , Management of Measurable Variable Cardiovascular Disease’ Risk Factors.CurrCardiolRev 14(3), 153-163.
- 6.Jilani M H, Javed Z, Yahya T. (2021) . Social Determinants of Health and Cardiovascular Disease: Current State and Future Directions Towards Healthcare Equity.CurrAtherosclerRep 23(9), 55-10.
- 7.Gaskin D J, Zare H, Jackson J W, Ibe C, Slocum J. (2021) . Decomposing Race and Ethnic Differences in CVD Risk Factors for Mid-life Women.J RacialEthnHealth Disparities 8(1), 174-185.
- 8.Vasan R S, Heuvel E Van Den. (2022) Differences in estimates for 10-year risk of cardiovascular disease in Black versus White individuals with identical risk factor profiles using pooled cohort equations: an in silico cohort study.Lancet Digit Health. 4(1), 55-63.
- 9.Gijsberts C M, Groenewegen K A, Hoefer I E. (2015) . Race/Ethnic Differences in the Associations of the Framingham Risk Factors with Carotid IMT and Cardiovascular Events.PloSOne 10(7), 0132321-10.
- 10.Arnett D K, Blumenthal R S, Albert M A. (2019) ACC/AHA Guideline on the Primary Prevention of Cardiovascular Disease:. , A Report of the American College of Cardiology/American Heart Association Task Force on Clinical Practice Guidelines.Circulation 140(11), 10-1161.
- 11.Schultz W M, Kelli H M, Lisko J C. (2018) . Socioeconomic Status and Cardiovascular Outcomes: Challenges and Interventions.Circulation 137(20), 2166-2178.
- 12.Paraswati M D, NAL Ati, Wihastuti T A, Utami Y W, Kumboyono K. (2020) . Correlation Analysis of Socio-Economic Status and Psychological Distress with Framingham Score in Population at Risk of Coronary Heart Disease in Malang, Indonesia.Int J Caring Sci 14(1), 487-496.
- 13.Ramsay S E, Morris R W, Whincup P H, Papacosta A O, Thomas M C et al. (2011) Prediction of coronary heart disease risk by Framingham and SCORE risk assessments varies by socioeconomic position: results from a study. in British men.EurJ Cardiovasc PrevRehabil 18(2), 186-193.
- 14.Ataklte F, Huang Q, Kornej J, Mondesir F, Benjamin E J et al. (2022) The association of education and household income with the lifetime risk of incident atrial fibrillation: The Framingham Heart study.AmJ PrevCardiol. 9, 100314-10.
- 15.Woodward M, SAE Peters, Batty G D. (2015) Socioeconomic status in relation to cardiovascular disease and cause-specific mortality: a comparison of Asian and Australasian populations in a pooled analysis.BMJ Open. 5(3), 10-1136.
- 16.Mosquera P A, San Sebastian M, Waenerlund A K, Ivarsson A, Weinehall L et al. (2016) Income-related inequalities in cardiovascular disease from mid-life to old age in a Northern Swedish cohort: A decomposition analysis.Soc Sci Med. 149, 135-144.
- 17.Kucharska-Newton A M, Harald K, Rosamond W D, Rose K M, Rea T D et al. (2011) . Socioeconomic Indicators and the Risk of Acute Coronary Heart Disease Events: Comparison of Population-Based Data from the United States and Finland.Ann Epidemiol 21(8), 572-579.
- 18.Cybulska B, Kłosiewicz-Latoszek L. (2019) Landmark studies in coronary heart disease epidemiology. The Framingham Heart. Study after 70 years and the Seven Countries Study after 77(2), 173-180.
- 19.Staerk L, Preis S R, Lin H. (2020) Novel Risk Modeling Approach of Atrial Fibrillation With Restricted Mean Survival Times: Application in the Framingham Heart Study Community-Based Cohort.Circ Cardiovasc Qual Outcomes. 13(4), 005918-10.
- 20.Walsemann K M, Goosby B J, Farr D. (2016) Life course SES and cardiovascular risk: Heterogeneity across race/ethnicity and gender.Soc Sci Med. 152, 147-155.
- 21.Karlamangla A S, Singer B H, Williams D R. (2005) Impact of socioeconomic status on longitudinal accumulation of cardiovascular risk in young adults:. , the CARDIA Study (USA).Soc Sci Med 60(5), 999-1015.
- 22. (2019) Centers for Disease Control and Prevention (CDC). National Center for Health Statistics (NCHS). National Health and Nutrition Examination Survey Questionnaire (or Examination Protocol, or Laboratory Protocol). Hyattsville, MD: U.S. Department of Health and Human Services, Centers for Disease Control and Prevention. https://wwwn.cdc.gov/nchs/nhanes/ .
- 23. (2023) NHANES Questionnaires, Datasets, and Related Documentation. Accessed. https://wwwn.cdc.gov/Nchs/Nhanes/
- 24.D’Agostino R B, Vasan R S, Pencina M J. (2008) General cardiovascular risk profile for use in primary care: the Framingham Heart Study.Circulation. 117(6), 743-753.
- 25. (2023) Cardiovascular Disease (10-year risk) |. , Framingham Heart Study. https://www.framinghamheartstudy.org/fhs-risk-functions/cardiovascular-disease-10-year-risk/
- 26.Levey A S, Stevens L A, Schmid C H. (2009) A New Equation to Estimate Glomerular Filtration Rate.Ann Intern Med. 150(9), 604-10.
- 27. (2019) Activity Guidelines for Americans.Physical Activity Guidelines Advisory Committee Report. US Department of Health and Human Services; .
- 28.Jing Fang, Zefeng Zhang, Carma Ayala, Thompson‐Paul Angela M, Fleetwood Loustalot. (2019) . Cardiovascular Health Among Non‐Hispanic Asian Americans: NHANES, 2011–2016.J Am Heart Assoc 8(13), 011324-10.
- 29.Alberti K G M M, Eckel Robert H, Grundy Scott M. (2009) Harmonizing the Metabolic Syndrome.Circulation. 120(16), 1640-1645.
- 30.Brothers R M, Fadel P J, Keller D M. (2019) Racial disparities in cardiovascular disease risk: mechanisms of vascular dysfunction.Am JPhysiol-Heart Circ Physiol. 317(4), 777-789.
- 31.Carnethon M R, Pu J, Howard G. (2017) Cardiovascular Health in African Americans: A Scientific Statement From the American Heart Association.Circulation. 136(21), 393-423.
- 32.Hackler E, Lew J, Gore M O. (2019) . Racial Differences in Cardiovascular Biomarkers in the General Population.J Am Heart Assoc 8(18), 012729-10.
- 33.Javed Z, Maqsood M H, Amin Z, Nasir K. (2022) Race and Ethnicity and Cardiometabolic Risk Profile: Disparities Across Income and Health Insurance in a. , National Sample of US Adults.J Public Health ManagPract 28, 91-10.
- 34.Ho F K, Gray S R, Welsh P. (2022) Ethnic differences in cardiovascular risk: examining differential exposure and susceptibility to risk factors.BMC. , Med 20(1), 149-10.
- 35.Jilani M H, Javed Z, Yahya T. (2021) . Social Determinants of Health and Cardiovascular Disease: Current State and Future Directions Towards Healthcare Equity.CurrAtherosclerRep 23(9), 55-10.
- 36.van Bussel EF, Hoevenaar-Blom M P, RKE Poortvliet. (2020) Predictive value of traditional risk factors for cardiovascular disease in older people: A systematic review.Prev Med. 132, 105986-10.
- 37.Markides K S, Hazuda H P. (1980) Ethnicity and infant mortality in Texas counties.Soc. , Biol 27(4), 261-271.
- 38.Markides K S, Coreil J. (1986) The health of Hispanics in the southwestern United States: an epidemiologic paradox.Public Health Rep. 101(3), 253-265.
- 39.Markides K S, Eschbach K. (2005) Aging, migration, and mortality: current status of research on. the Hispanic paradox.JGerontolB Psychol Sci Soc Sci. 60 Spec No 2, 68-75.
- 40.Fernandez J, García-Pérez M, Orozco-Aleman S. (2023) . , Unraveling the Hispanic Health Paradox.J EconPerspect 37(1), 145-167.
- 41.Elder T E, Goddeeris J H, Haider S J. (2016) . Racial and Ethnic Infant Mortality Gaps and the Role of Socio-Economic Status.LabourEcon 43, 42-54.
- 42.Antman F M, Duncan B, Trejo S J. (2020) Ethnic attrition, assimilation, and the measured health outcomes of Mexican Americans.JPopulEcon. 33(4), 1499-1522.
- 43.Hernandez C M, Moreno O, Garcia-Rodriguez I, Fuentes L, Nelson T. (2022) The Hispanic Paradox: A Moderated Mediation Analysis of Health Conditions, Self-Rated Health. and Mental Health among Mexicans and Mexican Americans.Health PsycholBehavMed 10(1), 180-198.
- 44.Jakob P, Lüscher T F. (2019) Dysfunctional HDL and inflammation: a noxious liaison in adolescents with type 1. , diabetes.EurHeart J 40(43), 3567-3570.
- 45.Richardson K, Richardson L, Bowden R. (2022) Association of High-Density Lipoprotein Cholesterol, Renal Function, and Metabolic Syndrome:. An Assessment of the 2013–2018 National Health and Nutrition Examination Surveys.Kidney Dial 2, 419-432.
- 46.Mazidi M, Mikhailidis D P, Banach M. (2019) Associations between risk of overall mortality, cause-specific mortality and level of inflammatory factors with extremely low and high high-density lipoprotein cholesterol levels among American adults.Int JCardiol. 276-242.
- 47.SAE Peters, Wang X, Lam T H. (2018) Clustering of risk factors and the risk of incident cardiovascular disease in Asian and Caucasian populations: results from the Asia Pacific Cohort Studies Collaboration.BMJ Open. 8(3), 10-1136.
- 48.Patel M, Abatcha S, Uthman O. (2022) Ethnic differences between South Asians and White Caucasians in cardiovascular disease-related mortality in developed countries: a systematic literature review.Syst Rev. 11(1), 207-10.
- 49.Pai R G, Vyas V. (2022) . Implications of Ethnicity in Subclinical Atherosclerosis in Underserved Populations.J Am CollCardiol 80(3), 230-232.
- 50.Lackland D T. (2014) Racial Differences in Hypertension: Implications for High Blood Pressure. , Management.Am J Med Sci 348(2), 135-138.
- 51.Hardy S T, Chen L, Cherrington A L. (2021) . Racial and Ethnic Differences in Blood Pressure Among US Adults, 1999–2018.Hypertension 78(6), 1730-1741.
- 52.Bozkurt N, Uzun S U, Bozkurt A I, Turgut S. (2022) Does Cardiovascular Disease Risk Decrease after Smoking Cessation. in Occupational Risk Groups?Heart Views Off J Gulf Heart Assoc 23(4), 208-214.
- 53.Martins I J. (2017) Single Gene Inactivation with Implications to Diabetes and Multiple Organ Dysfunction Syndrome. 3(3), 10-21767.