Abstract
The aims of this study are to investigate the variation in the mechanical behaviour of the primary cancer from cancer relapse, and measuring the therapeutic resistance acquired by cancer relapse. A431-cultured cells were irradiated for 7 months until 85 Gy. Then, a selected single cell was left to grow as stable A431-R cell line. 106 cells of A431 cells and 106 of A431-R cells suspended in 100 μL of medium were injected into subcutaneous tissues on the right thigh of athymic mice to generate tumor xenografts models of primary cancer (A431-P) and cancer relapse (A431-R). Radiotherapy of a low-dose of 30Gy was applied on xenoimplanted tumors after one week from inoculation. A mock process was performed on untreated groups of mice for controls. Tumor size was monitored starting from inoculation and tumor growth was measured along 42 days. Rates of mitosis and apoptosis and the histologic grade (HG) that characterize the tumor response were determined as described in earlier studies. Alterations induced on tumor HG in the treated models were 100% identical to the energy of the applied doses. The differences in response energy between cancer relapse and primary cancer irrespectively of the treatment (untreated vs. treated) or origin of the cells (A431-P vs. A431-R) in all phases of tumor responses (growth, shrinkage or regrowth) were 100% identical to the total differences in the administered regimens applied on those groups during those phases. Cancer relapse is characterized by a delay in growth before second line therapy for its relatively lower rate of mitosis compared by the primary cancer inducing a corresponding delay in the early detection. The therapeutic resistance of the cancer relapse is equivalent to the energy of the doses which have been delivered in the prior therapies, and requires increasing the administered dose by an amount equivalent to that resistance.
Author Contributions
Academic Editor: Suliman Salih, College of Applied Medical Sciences, Taibah University
Checked for plagiarism: Yes
Review by: Single-blind
Copyright © 2017 Emad Y. Moawad, et al.
 This is an open-access article distributed under the terms of the Creative Commons Attribution License, which permits unrestricted use, distribution, and reproduction in any medium, provided the original author and source are credited.
Competing interests
The authors have declared that no competing interests exist.
Citation:
Introduction
Although all types of cancer therapies has improved treatment success rates over the past decade, but that success is fraught with a high rate of recurrences as the majority of patients experience a relapse, and in most patients, the disease persists 1, 2. Therefore, the development of more effective therapies would be instrumental in the ability to fight cancer 3, 4. The late-stage diagnosis and ineffective treatment contribute to a very poor prognosis for patient with cancer 5. The etiologies of cancer relapse are adequate their effects contribute in the increase of cancer patients' histologic grade than that of healthy people. Such increase is might be due to either the insufficient dose or the over dose compared by the patient histologic grade in the first therapy 4. The increase in the histologic grade cannot be monitored by the current screening methods before relapse for its too long half-life time compared to the primary cancer. Afterwards, the effective therapy should be started by precise staging identifies the personalized cancer medicine to avoid risks of invasion and metastasis 6, 7. Accordingly, cancer treatments for cancer relapse should be distinguished from those of primary cancer. The higher histologic grade of patients of relapse compared by those of primary cancer should be taken into account by increasing the administered doses as much as the increase in the histologic grade 8, 9. There will be a completely different response between the cancer relapse and the primary cancer of same type and size. The cancer relapse has a significant resistance compared by the primary cancer to same therapy. Such difference in response is attributed to the administered dose of first therapy that patients of relapse underwent. The current approach shows that the difference in the response energy would be equivalent to the difference of energy between the total dose delivered in all treatments applied to patients of cancer relapse and dose delivered in the first treatment applied to the primary cancer patients. Or in other words, the acquired resistance of cancer relapse exhibited to the following therapies would be equivalent to the total dose delivered in all treatments applied to patients before relapse. The understanding of this complex process is hindered due to the lack of appropriate study models in which the emergence of resistance can be directly attributed to specific changes induced by prior therapy. An experimental development of a radioresistant isogenic cancer cell line was performed. Two models of murine tumors xenografts were generated and each model was divided into two groups, one was treated and the other was untreated for control. One of the models was generated from the inoculation of that radioresistant isogenic cancer cell line to model cancer relapse and the other generated from the inoculation of the same type of cancer cell line but in its normal molecular characterization to model primary cancer. Current approach demonstrates that the difference in the response energy between the two models to same therapy is equivalent to that of the total dose delivered to develop the radioresistant isogenic cancer cell line to generate the cancer relapse model.
Methods and Materials
As conducted and described by Josep Balart et al 10
Cancer Cell Lines and Clonogenic Assays
The human epidermoid carcinoma cell line A431 from the American Type Cell Collection (LGC Promochem, Barcelona, Spain) was used in this study. Cells were maintained as a monolayer under standard cell culture conditions. Cells growing in 100-mm plastic dishes were irradiated at room temperature (RT) using 6-MV X-rays at dose rate of 2.7 Gy/min. Cultures were progressively treated with daily rounds of radiation over a 7-month period of time, starting with 0.75 Gy/fraction and ending with 3 Gy/fraction. Irradiation was stopped, as necessary, in order to allow for cell monolayer recovery. The procedure was continued until a total of 85 Gy had been delivered. Next, single cell suspension (1000 cells per 60-mm dishes) were plated and allowed to grow as macroscopic colonies. Afterwards, cells were grown from the colony that showed the most vigorous growth to the confluence and expanded them. These cells were denominated as A431-R cell line and used to generate a cancer relapse in mouse model.
Tumor Xenografts
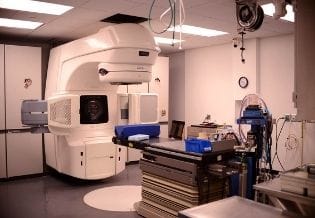
Six to eight week old female athymic Swiss nu/nu mice were purchased from Harlan (Gannat, France) and were housed under pathogen free conditions at our facilities (AAALAC accreditation number 1155). 106 of A431 cells or 106 of A431-R cells suspended in 100 μL of medium were injected into subcutaneous tissues on the right thigh of athymic mice to generate tumor xenografts models of primary cancer dominated by A431-P and cancer relapse dominated by A431-R. Radiotherapy of xenoimplanted tumors was performed after one week from inoculation. A low-dose of 30 Gy was applied on 10 fractions of 3 Gy each in 2 weeks at 2.7 Gy per minute. A complete mock process was performed on untreated groups of mice that served as experimental controls.
The Mechanical Behavior of the Primary Cancer and Cancer Relapse Models
Tumor size was calculated using the formula: π/6 x (large diameter) x (small diameter)2. Tumor growth was measured twice weekly until tumors reached 1500 mm3 in size. Thus, each of the doubling time (tD) of tumor growth and half-life time (t1/2) of tumor shrinkage were determined. Comparing the mechanicalbehavior of tumor response for the studied tumors before, during and after therapy or without therapy was assessed on determining the growth/or shrinkage constants of those tumors of different volumes along each period to express the difference in rates of Mitosis and Apoptosis (M – A) that characterize the tumor response along those periods. If rate of mitosis was greater than that of apoptosis (M > A), tumor grew by growth constant of ln2/tD, and vice versa if rate of mitosis was less than that of apoptosis (M < A), tumor shrunk by shrinkage constant of 

i.e. (M – A)=  in case of tumor growth,
&
(A – M) =  in case of tumor shrinkage,
Where tD and t1/2 in seconds Eqt (1).
Moawad presented a clinical staging model at the cellular level in which the tumor histologic grade (HG) that expresses tumor response (M - A) can be identified as follows:

where Co h is number of the hypoxic cells in the tumor or number of the inoculated cells in the transplanted tumor Model 3, 4, 6, 7, 8, 11.
Thus, tumor Energy/Mass = 
Gy 
From Eqt 1, Tumor Energy/Mass =  Gy Eqt (2)
Accordingly, from equation (2) the Energy/Mass corresponds to the difference in response of any two tumors (A and B) can be determined according to the following model:

 Gy Eqt (3)
Results and A nalysis
As conducted and described by Josep Balart et al 10; Table 1 shows the average tumor size of 5 tumors for the four groups of xenografted tumors; untreated A431-P, A431-R and treated A431-P, A431-R before, during and after radiotherapy 10.
Table 1. Shows the monitored tumor volume of untreated or treated primary cancer and cancer relapse models.| Day | Volume of non irradiated tumors in mm3 | Volume of irradiated tumors in mm3 | |||
| A431-P | A431-R | A431-P | A431-R | ||
| 7 | Beforeirradiation | 51.3 | 30.73 | 51.3 | 30.73 |
| 16 | Irradiation period | 343 | 444 | ||
| 17 | |||||
| 21 | 1120 | 1092 | 226.4 | 401.6 | |
| 25 | After irradiation | 162.78 | 269.91 | ||
| 42 | 727 | 970.3 | |||
Seven days after cell injection all animals exhibited tumor growth in the subcutaneous tissues of the right thigh. The average tumor size just before radiotherapy was 51.30 ± 8.8 mm3 with doubling time (tD) of 1.23 day for A431-P cells and 30.73 ± 7.4mm3 with tD of 1.417 day for A431-R cells (p = 0.11). Without irradiation, tumours exponentially grew as a function of time both types of cells showing similar patterns. The greater growth delay was observed in the A431-R tumor model compared to that observed in the A431-P tumor model. At day 21, the tumors from A431-P cells measured 1120 ± 151.4mm3with tD of 3.147 day and those from A431-R cells 1092 ± 250.5mm3with tD of 2.72 days. The effect of fractionated radiotherapy on the growth of xenografted tumors was evaluated. Observation indicated that tumor growth was inhibited by radiotherapy in the A431-P tumor model only as its size grew to 343mm3 at day 16 -from implanting tumors- with tD of 3.281 days. In contrast, tumor growth was increased in the treated A431-R tumor model more than the untreated A431-R exhibiting a therapeutic resistance as its size grew to 444mm3 at day 17 from implanting tumors with tD of 2.595 days. The therapeutic resistance exhibited by the treated A431-R tumor model was observed also in the form of slower shrinkage compared by the treated A431-P tumor model; the treated A431-P tumors shrunken to 162.78mm3 with half-life time (t1/2) of 7.44 days at day 24, whereas A431-R tumors shrunken to 269.91mm3 at day 24 with t1/2 of 9.748 days. After therapy both tumors models had followed a re-growth in which the treated A431-R model was slower in re-growth as before therapy; the treated A431-P re-grew to 727mm3 with tD of 8.317 days at day 42, whereas A431-R tumors re-grew to 970.3mm3 with tD of 9.75 days at day 42. Accordingly from Eqts (1-3), the cellular mechanics that express (M – A) and tumor Energy/Mass along those phases of different responses of tumor progression in those models can be identified.
Comparing the Cellular Mechanics in Primary and Relapsed Tumor Models
From Eqt 1and as shown in Table 2, Figure 1 shows the cellular mechanics in the cancer relapse model A431-R compared by the primary one A431-P along the monitored periods. While Figure 2 shows a comparison between the cellular mechanics of tumor progression of each model.
Table 2. Shows Energy/Mass and the difference in rates of Mitosis and Apoptosis (M-A) in A431-P and A431-R models along monitored periods.| Day | A431-P | A431-R | Difference in Energy/Mass(Gy) | |||
| (M – A) in 1/S | Energy/Mass (Gy) | (M – A) in 1/S | Energy/Mass (Gy) | |||
| 7 | Beforeirradiation | 6.51 |
18,463.1 | 5.66 |
18,549.5 | 86.4 |
| 21 | Without irradiation | 2.55 |
19,025.8 | 2.95 |
18,940.6 | 85.2 |
| 16 | Irradiation period | 2.44 |
19,049.84 | 3.09 |
18,913.6 | 136.2= 85.2 +24+27 |
| 17 | ||||||
| 24 | -1.08 |
19,507.2 | -8.23 |
19,652.2 | 145=85+30+30 | |
| 42 | After irradiation | 9.65 |
19,567.38 | 8.23 |
19,652.38 | 85 |
Figure 1.Shows a comparison between (M – A) in primary cancer and cancer relapse models before, during and after therapy.
Rate of growth and re-growth (M-A) of A431-P was faster than that of A431-R before and after therapy to confirm the easier early detection of the primary than the relapsed cancer. At the beginning of the therapy (M-A) of A431-P was slower than that of A431-R. Also, the rate of shrinkage (A-M) of A431-P was faster than that of A431-R due to therapy to show how therapy is more efficient in treating the primary tumor than treating the relapsed one by the same regimen. These findings confirm also that A431-R tumor model was more resistant to therapy than A431-P tumor model responsible for that difference in the mechanical behaviour.
Figure 2.shows a comparison between (M-A) before, during and after therapy for primary cancer and cancer relapse models.
Comparing Energy/Mass in Primary cancer and cancer relapse models
At Day 7 just before Therapy
From Eqt 2, Energy/Mass in those groups just before radiotherapy at day 7 was as follows:
For A431-P tumors:
Energy/Mass =  =18,463.1Gy
For A431-R tumors:
Energy/Mass =  =18,549.5Gy
Thus, the difference in Energy/Mass corresponds to the difference in the response of those models just before radiotherapy at day 7 was (18,549.5 - 18,463.1) 86.4 Gy.
Alternatively in one step from Eqt 3, the difference in Energy/Mass corresponds to the difference in the response of those models just before radiotherapy at day 7 was as follows:


 =86.4Gy
which is 98.4% identical to the administered Energy/Mass in A431-R cell line development (85 Gy).
At Day 21 for the Untreated Groups
The difference in Energy/Mass corresponds to the difference in response of the untreated (control) groups of the two models at day 21 was as follows:
 = 85.27 Gy,
which is 99.7% identical to the administered Energy/Mass in A431-R cell line development (85 Gy).
With respect to the treated groups, both models passed by three phases; growth at the start of radiotherapy followed by shrinkage and regrowth after radiotherapy.
Growth Phase During Treatment
From Eqt 3, the difference in Energy/Mass corresponds to the difference in the response of treated groups in the growth phase during treatment was as follows:
 =136.24 Gy.
This result indicate that tumors of cancer relapse model derived from A431-R cells were more resistant to radiotherapy than those of primary cancer model derived from A431-P cells by136.24 Gy which is 99.8% identical to the sum of the administered Energy/Mass in A431-R cell line development and that delivered by both models in growth phase during radiotherapy (85 + 27 + 24 = 136 Gy). The difference in tumor Energy/Mass of primary cancer model derived from A431-P cells in the treated groups than those of same type of cells in the untreated groups in the growth phase was as follows:

 =23.9 Gy,
which is 99.5% identical to dose delivered by treated A431-P model (24 Gy) in the growth phase during radiotherapy. This means that tumors of treated A431-P model responded effectively by 99.5% to therapy (24 Gy). While, the difference in tumor Energy/Mass of cancer relapse model derived from A431-R cells in the treated groups than those of same type of cells in the untreated groups in the growth phase was as follows:
 = -26.98 Gy of absolute value 99.9% identical to dose delivered by treated A431-R model (27 Gy) in the growth phase during radiotherapy.
The negative sign indicates the therapeutic resistance exhibited by the treated A431-R tumor model in the form of increasing growth during therapy was equivalent to 99.5% to the dose delivered by treated A431-R model in the growth phase during radiotherapy therapy (27 Gy).
Shrinkage Phase During Treatment
The difference in Energy/Mass corresponds to the difference in the response of in the treated groups in the shrinkage phase due to radiotherapy was as follows:
 =145Gy,
which is 100% identical to the sum of the delivered Energy/Mass in both models in first and second therapies ((85 +30) Gy for A431-R tumor model + 30 Gy for A431-P tumor model). This means that the therapeutic resistance exhibited by the treated A431-R tumor model in the form of decreasing rate of shrinkage during therapy was 100% identical to the sum of the delivered Energy/Mass in both models in first and second therapies.
Re-Growth Phase after Therapy
The difference in Energy/Mass corresponds to the difference in the response of the treated groups in the re-growth phase after therapy was as follows:
 = 85Gy,
which is 100% identical to the dose delivered by the treated A431-R in first therapy. This indicates that the second therapy affected both treated models equally as difference in Energy/Mass of their re-growth was 100% identical to that of first therapy regimen.
Table 2 shows Energy/Mass of those tumors along each period and the difference in rates of Mitosis and Apoptosis (M-A) to compare the mechanicalbehavior of the studied tumors. Also, Figure 3 shows a comparison between the monitored Energy/Mass along phases of tumor progression in each model separately. While Figure 4 shows Energy/Mass in the cancer relapse model A431-R and that in the primary one A431-P along the monitored periods.
Figure 3.Shows a comparison between the monitored Energy/Mass along phases of tumor progression in primary cancer and cancer relapse separately.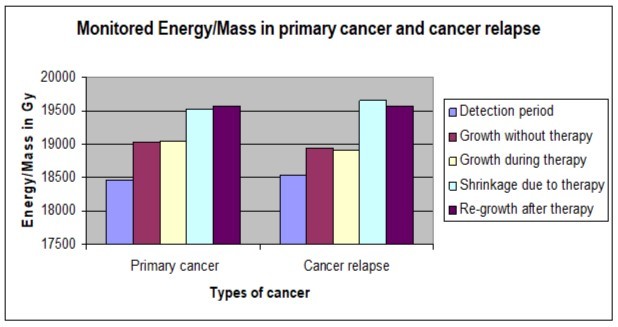
(Obviously, during the whole follow-up period as shown in Table 2, Figure 3 and Figure 4 the difference in response of Energy/Mass in A431-P and A431-R tumor models was maintained at 100% identical to that of the administered Energy/Mass in A431-R cell line development (85 Gy) and that administered in therapy for lack of response to treatment shown by A431-R model; (24 + 27 = 51 Gy) delivered by the two models in growth phase during therapy or (30 + 30 = 60 Gy) delivered by the two models in shrinkage phase due to therapy. While, the difference in response of Energy/Mass in each type of the treated models compared by that in the untreated model of same type was also maintained at 100% identical to that delivered during therapy (24 Gy delivered by the treated A431-P, 27 Gy delivered by the treated A431-R in second therapy more than the untreated A431-R).
Figure 4.Shows Energy/Mass in the cancer relapse model and that in the primary cancer model along the monitored periods.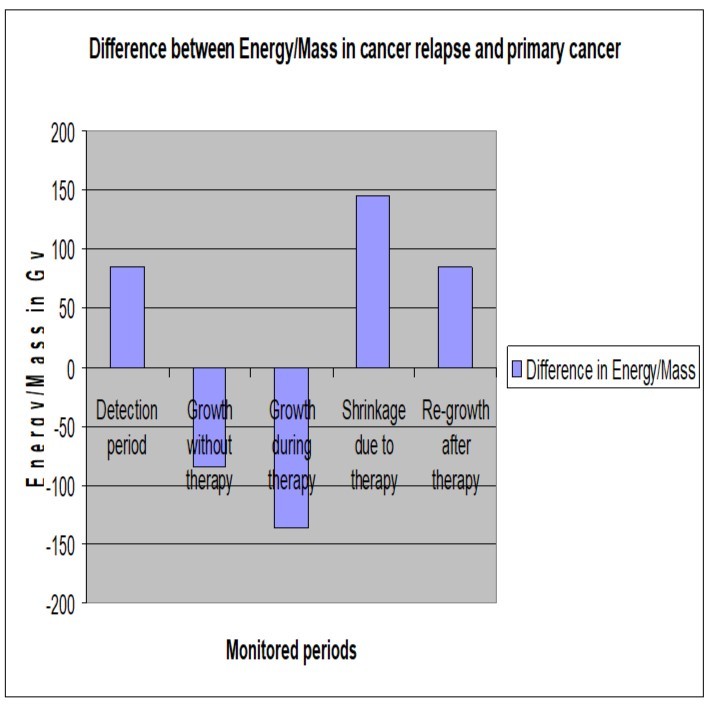
Discussion
This study demonstrates the difference in the mechanical behavior of primary cancer and cancer relapse in all phases before and after therapy. The mechanisms involved in the acquisition of an aggressive resistant phenotype are complex. In vivo tumor models in athymic mice were used to study tumorigenesis and assay efficacy of novel therapeutics. Observations demonstrated that inhibition to tumor growth induced by radiotherapy depends on the HG of the tumor that determines its stage. The clinical methodology for staging tumors was conducted as described in earlier studies to determine the energy of tumor responses 3, 4, 6, 7, 8, 11. The cancer relapse model was characterized by a delay in each of tumor formation and regrowth before and after therapy compared by the primary cancer model. With respect to the delay of cancer relapse in tumor formation reflects the difficulties in its early detection compared by the primary cancer and explains the local recurrences as the acquisition of a radioresistant pattern by a small proportion of cancer cells 18, 19, 20, 21, 22, 23. Such delay before and after therapy is attributed to it's relatively higher HG than that of primary cancer gained due to first therapy as shown in Table 2. The rate of the mitosis in the model of primary cancer was greater than that in the relapsed one before therapy. Such increase in rate of mitosis reflected in the greater volume with lower HG of the model of primary cancer than that of the cancer relapse model as shown in Table 2 and illustrated in Figure 1. This clarifies that primary cancer is characterized by a higher rate of mitosis enables an earlier detection and lower HG allows lower administered dose than that of the cancer relapse of same volume. Observations demonstrated also that the cancer relapse model exhibited a resistance to therapy whether in growth or shrinkage during therapy. The treated cancer relapse model was faster in growth than each of its control (untreated A431-R) and the treated primary cancer model, but slower in shrinkage due to therapy than the treated primary tumor. The rate of the apoptosis in the model of primary cancer was higher than that in the cancer relapse one along the two phases of therapy. The increase in rate of apoptosis was showed clearly in the faster shrinkage of the model of primary cancer than that of the cancer relapse model. This clarifies that therapy triggers apoptosis efficiently in primary cancer more than that in the cancer relapse, whereas expresses the resistance acquired by the cancer relapse that needs to be taken in consideration by increasing the administered dose than that of primary cancer therapy by an amount equivalent to the acquired resistance. Estimating the acquired resistance by the relapsed cancer was conducted by monitoring the difference in tumor responses and the accompanied alteration in the tumor HG before, during and after therapy. It was possible to correlate the energy the anti-cancer drug perfectly with the induced alteration in the tumor HG along all phases of the tumor responses to therapy. The conformity between values of doses energy and the corresponding alteration in the tumor HG provides a clear-cut criterion for accepting the hypotheses of the equivalence between the effect on the tumor HG induced by the anti-cancer drug and the energy yield by the drug dose as shown in Table 2. The presented model demonstrated that A431-R cells were exposed to sum of doses of 85 Gy before inoculation in mice to represent a dose of first therapy for the cancer relapse model. The energy of such dose was not surprisingly to be equivalent to the increase of cancer relapse HG during tumor formation than that of the primary cancer of same type and number of inoculated cells. Variation in HG of both tumors models was observed; before therapy the HG of A4312-R tumors was higher than that of A431-P exhibiting a resistance to growth by amount of energy equivalent to that delivered in the first therapy applied on A4312-R model (85 Gy). Also during therapy variation in HG of both models was observed in the treated groups compared by that of the control groups. In the growth phase during therapy, HG of the treated A4312-P model was higher than that of untreated A431-P model exhibiting a resistance to growth by amount of energy equivalent to that delivered by 8 fractions of 3Gy each of sum of 24 Gy applied in the growth interval during radiotherapy. On the contrary, in the period of growth phase during therapy the HG of treated A4312-R tumors in contrast to the other type of tumor model was lower than that of the untreated (control) A431-R tumors exhibiting an obvious resistance to therapy by amount of energy equivalent to that delivered by a sum of fractions of 27 Gy delivered in the growth interval during radiotherapy. Also in the same interval of growth phase during therapy, the HG of treated A4312-R tumors in contrast to the other periods before or after therapy was lower than that of the treated A431-P tumors exhibiting an obvious resistance to therapy by amount of energy equivalent to that delivered by both models of tumors in both therapies till the end of the growth interval during radiotherapy (85 + 24 + 27= 136 Gy). Also in the shrinkage phase, the HG of treated A4312-R tumors was higher than that of treated A431-P exhibiting a shrinkage resistance by amount of energy equivalent to that delivered in both therapies conducted on both types of treated tumors (85 + 30+ 30 = 145 Gy). After therapy in the re-growth phase the HG of treated A4312-R tumors was higher than that of treated A431-P exhibiting a re-growth resistance by amount of energy equivalent to that delivered in the first therapy conducted on A4312-R cells (85 Gy). Those observations suggest that tumor adaptation to therapy induces the emergence of drug resistance and the malignant phenotypes of higher HG can ultimately determine the clinical outcome of recurrences after therapy 24, 25, 26. Together with these findings and analysis irrespectively of the treatment (untreated vs. treated) or origin of the cells (A431-P vs. A431-R) in all phases of tumor responses (growth, shrinkage or regrowth), provide a clear cut criterion to accept the hypotheses of the equalization of the difference in response energy between cancer relapse and primary cancer and that of the administered regimen in first therapy of patients of cancer relapse. In addition, the conformity between values of doses energy and the corresponding alteration in the tumor HG in all phases reveals the importance of differentiating between the administered doses of primary cancer and that of cancer relapse as it is proved that the therapeutic resistance of the cancer relapse contributes significantly to treatment failure and would be equivalent to the amount of dose energy delivered in the first therapy.
Conclusion
Differences in rates of mitosis and apoptosis are responsible for the variation in the mechanical behaviour of the primary cancer from cancer relapse. Their performance differs in all phases by an amount of energy equivalent to that delivered to the cancer relapse in the first line therapy. The cancer relapse is characterized by a delay in growth before second line therapy for its relatively lower rate of mitosis compared by the primary cancer which causes a corresponding delay in early detection. The cancer relapse acquires a resistance to second line therapy equivalent to that delivered in the first line one. During therapy, cancer relapse responds slower than the primary cancer for its lower rate of apoptosis which requires increasing the administered dose by an amount equivalent to that delivered in the first line therapy.
References
- 1.Shepherd J E. (2000) Current strategies for prevention, detection, and treatment of ovarian cancer. , J Am Pharm Assoc (Wash); 40, 392-401.
- 2.Herrin V E, Thigpen J T. (1999) Chemotherapy for ovarian cancer: current concepts. Semin Surg Oncol. 17, 181-8.
- 3.Moawad E. (2010) Isolated System Towards A Successful Radiotherapy Treatment. Nucl Med Mole Imaging. 44, 123-136.
- 4.Moawad E Y. (2011) Radiotherapy and risks of tumor regrowth or inducing second cancer. Cancer Nano. 2, 81-93.
- 5.Marsden D E, Friedlander M, Hacker N F.Current management of epithelial ovarian carcinoma: a review. Semin Surg Oncol 2000;19:. 11-9.
- 6.Moawad E Y. (2012) Clinical and pathological staging of the cancer at the nanoscale. Cancer Nano. 3, 37-46.
- 7.Moawad E Y. (2012) Reconciliation between the clinical and pathological staging of cancer. doi: 10.1007/s00580-012-1603-6. Comp Clin Pathol.
- 8.Moawad E Y. (2013) Administering the optimum dose of L-Arginine in regional tumor therapy. doi: 10.1007/s12291-013-0379-z .Ind J Clin Biochem.
- 9.Moawad E Y. (2013) Induction of Multiple Sclerosis and Response to Tyrosine Kinase Inhibitors.doi: 10.1007/s12291-013-0387-z. Ind J Clin Biochem.
- 10.de Llobet LI, Baro M, Figueras A, Modolell I, Da Silva MV et al. (2013) Development and characterization of an isogenic cell line with a radioresistant phenotype. Clin Transl Oncol. 15(3), 189-97.
- 12.Moawad E Y.Nuclear Transmutation and Cancer in the Biological Cell.International. , Journal of Biochemistry and Biophysics; 1, 1-8.
- 13.Moawad E Y. (2012) Optimizing Bioethanol production through regulating Yeast Growth Energy. Syst Synth Biol. 6, 61-68.
- 14.Moawad E Y. (2013) Growth Energy of Bacteria and the Associated Electricity Generation in Fuel Cells. Bioengineering and Bioscience. 1, 5-10.
- 15.Moawad E Y. (2013) Safe Cancer Screening for Patients after Lumpectomy, Survivors, and Healthy Subjects. Cancer and Oncology Research. 1, 15-23.
- 16.Moawad E Y. (2013) Induction of Rheumatoid Arthritis and Response to Tyrosine Kinase Inhibitors. , Universal Journal of Medical Science; 1, 50-55.
- 17.Moawad E Y. (2013) Cell Growth Energy Represents a Measure for Man Health; Regulates Nuclear Transmutations and Aberrant Activation in Human Cell. , Universal Journal of Medical Science; 1, 27-35.
- 18.Bartkova J, Horejsi Z, Koed K. (2005) DNA damage response as a candidate anti-cancer barrier in early human tumorigenesis. , Nature 434, 864-870.
- 20.Phillips T M, McBride W H, Pajonk F. (2006) The response of CD24 (-/low)/CD44+ breast cancer-initiating cells to radiation. , J Natl Cancer Inst 98, 1777-1785.
- 21.Keith B, Simon M C. (2007) Hypoxia-inducible factors, stem cells, and cancer. , Cell 129, 465-472.
- 23.Comen E, Norton L, Massague J. (2011) Clinical implications of cancer self-seeding. , Nat Rev Clin Oncol; 8(6), 369-377.
- 24.F De Bacco, Luraghi P, Medico E. (2011) Induction of MET by ionizing radiation and its role in radioresistance and invasive growth of cancer. , J Natl Cancer Inst 103, 645-661.