High-Throughput Complex Disease Modeling for Ethical Drug Discovery: Clinical Relevance of a NAM Platform for Cancer Biomarker Development

Abstract
The development of tumor biomarkers derived from blood, or its components, has become pivotal in advancing early cancer diagnosis. Malignant transformations induce cancer-specific alterations in the transcriptome, proteome, and secretome of tumor cells. Recent studies highlighted similar alterations in peripheral blood mononuclear cells (PBMCs) in cancer patients, which appear to mirror the state of transformation in tumor cells. These findings suggest an intercellular communication–driven mechanism rather than a systemic inflammatory response and, in addition to current ctDNA-based liquid biopsy biomarkers, point to a novel, simple, and highly robust approach for the early detection of cancer. Using this phenomenon to advance PBMC-based biomarker development, it will be essential to achieve 3D in vitro tumor models that reproduce a highly physiological tumor microenvironment (TME). Likewise, more enhanced 3D ex vivo models are required to enable the replication of cell-to-cell and organ-to-organ communication. These systems will guide the self-organization of mixed microenvironments derived from different tissues and enable them to accurately reproduce the molecular connections underlying these alterations. In this study, an innovative new modular 3D co-culturing approach was used to expose PBMCs to lung tumoroids, under physiologically relevant conditions. Changes in DNA fragmentation of PBMCs in the presence of lung cancer were quantified and used as a biomarker. To validate the predictiveness of this biomarker, our results were compared with clinical data from a clinical evaluation study. Similar to the clinical trial observations, PBMCs, when exposed to lung tumoroids, showed a significantly lower level of DNA fragmentation (37%). This modular 3D co-culturing model showed a predictiveness of the clinical data of > 90%, demonstrating its power to monitoring cell-to-cell communication effects and support the development of blood-based biomarkers.
Article Information
- Received
- Accepted
- Published
Academic Editor: Ian James Martins, Principal Research Fellow Edith Cowan University
Checked for plagiarism: Yes
Review by: Single-blind
Copyright © 2026 Emma Dillier, et al.
 This is an open-access article distributed under the terms of the Creative Commons Attribution License, which permits unrestricted use, distribution, and reproduction in any medium, provided the original author and source are credited.
Corresponding author: Arne-C. Faisst, 4D Lifetec AG, Switzerland —
Competing Interests
The author declares no conflict of interest.
Funding
No specific funding statement was provided by the authors.
Data Availability
No data-availability statement was provided by the authors.
Citation:
Introduction
With low success rates in clinical trials, new anti-cancer drug discovery remains a slow and costly activity 1. More than half of all drugs fail in Phase II and Phase III clinical trials due to a lack of efficacy and another third of drugs fail due to safety issues including an insufficient therapeutic index despite promising results in the pre-clinical phases 2, 3. The high failure rate in drug discovery is largely due to the lack of predictive power and physiological relevance of current preclinical models 4. Likewise, the identification and comprehensive characterization of tumor biomarkers of clinical value are impeded by the limitations of preclinical models employed5.
Since the 1900’s, drug discovery and development relied strongly on two-dimensional (2D) cell monolayers, to evaluate the potential risks and effectiveness of new drug candidates in humans 6, 7. However, most physiological parameters of organs or tumors such as tissue architecture, cell-to-cell and cell-to-matrix interaction, mechanical properties and biochemical networks summarized as microenvironment are lost under these simplified conditions 8, 9. On the other hand, animal models widely used to mimic human biology and for drug development studies are expensive, difficult to handle and have significant disadvantages due to the intrinsic differences between species and limited throughput despite increasing demand 10, 11. Furthermore, preclinical observations in animals have not always been translated into clinical performance, due to differences in the assessment of pharmacokinetics and pharmacodynamics compared to humans 12, 13, 14. All these deficits in current in vivo-based preclinical drug development urge the development of in vitro novel next-generation tumor models that can recapitulate the tumor microenvironment accurately for more efficient drug testing and less failure-prone efficacy predictions.
With the promise of finally realizing effective preclinical drug screening, the development of three-dimensional (3D) models has been gaining strength over the last decade 15. Currently, there are several types of 3D culture systems available, from simple spheroids to more complex organoids and organ-on-chips, and from single-cell type static 3D models to modular organ-to-organ co-culture 3D models 16, 17. Among the more complex models, the latter present relevant physiological cell microenvironments, and a higher degree of morphological and functional differentiation, hence they recapitulate the in vivo biology of tumors a lot better than preexisting 2D or simplified 3D models18, 19.
The 3D CoSeedis™ Multi-Organoid Model is a novel humanized 3D cell culture system that generates between 200 and 1000 tumoroids simultaneously. In contrast to conventional 3D platforms, this new Multi-Organoid in chip Technology™ allows assembly, growth, maintenance and drug exposure of all tumoroids under identical, reproducible biological conditions and consequently leads to an unprecedented level of homogeneity and uniformity amongst all tumoroids formed. The 3D CoSeedis™ matrix is fully permeable to nutrients, gases, and protein factors including growth factors and even antibodies, allowing chip-wide self-assembly of a physiological micro-environment that ultimately leads to the level of homogeneity described above20, 21. The 3D CoSeedis™ Multi-Organoid Models effectively bridge the existing gap in in vitro drug development between oversimplified 2D or 3D spheroid models, produced in high numbers, and complex, biologically relevant organoids available only in limited quantities. It enables the generation of physiologically relevant tumoroids in statistically robust quantities, supporting more precise efficacy predictions in drug discovery22.
The 3D CoSeedis™ Multi-Organoid Disease Models have been used for a wide range of studies on molecular mechanisms of cancer 23, 24, 25, 26, drug/treatment response 27, 28, 29, 30, and tissue engineering 31. Furthermore, the underlying Multi-Organoid in chip Technology™ demonstrated a high capacity to accurately replicate human drug response profiles in various studies32.
Clinically, DNA Damage Sensitivity (DDS) detecting the quantity of DNA fragments in PBMCs has been proposed as an early-stage cancer biomarker and shown to reflect malignant transformation in tumor tissues 33, 34. In this study, we evaluate whether the 3D CoSeedis™ Multi-Organoid Oncology Model can serve as a novel, highly accurate in vitro model for detecting DDS. Furthermore, the efficient detection of DDS by this model could represent a novel approach to validate the applicability of this biomarker to other cancer types before initiating extensive and costly clinical studies. PBMCs from healthy donors were seeded and cultured on the 3D CoSeedis™ platform and subsequently exposed to non-small cell lung cancer tumoroids. DNA fragmentation following UVB irradiation was quantified using high-performance single-cell gel electrophoresis35. To evaluate the clinical relevance and predictive accuracy of the novel assay, in vitro measurements of DNA fragmentation and DDS were compared with corresponding data obtained from PBMCs of cancer patients 33, 34, 35. This comparison demonstrated a strong qualitative and quantitative correspondence between patient-derived DDS values and those generated using the newly developed 3D CoSeedis™ Multi-Organoid Model. These findings indicate that the DNA fragmentation responses measured in the in vitro system closely recapitulate the quantitative effects of epithelial transformation on surrogate cells, such as PBMCs, observed in tumor patients thereby demonstrating its potential as a powerful development platform with high predictive capacity for biomarker discovery and development.
Materials and Methods
Blood samples and PBMCs isolation
Blood sample collection and PBMC isolation were performed according to protocol of the 4DC-05001-IFU-Blood Kits (4D Lifetec, Switzerland) and the user instructions of BD Vacuatainer® CPT™ (Product no 362780). Briefly, 8 mL whole blood was drawn from healthy individuals in Vacutainer® CPT™ tubes (BD Vacutainer, USA). Maximum 2 h after blood collection Vacutainer® CPT™ tubes were inverted to mix the blood sample prior to centrifugation at room temperature for 20 min at 1650 x g in a horizontal swing-out head rotor with the break turned off. After centrifugation, half of the plasma fraction was discarded, and the cell fraction was transferred into a 15 mL conical tube. The tube was then filled up with cell culture medium (RPMI 1640 medium (Biowest, USA) supplemented with 10 % heat-inactivated FCS (Biowest, USA), mixed by inversion, and centrifuged for 15 min at 300 x g. The supernatant was carefully discarded. The pellet was resuspended in cell culture medium and the tube filled up to 10 mL and mixed by inversion. Cells were centrifuged again for 10 min at 300 x g and the supernatant was discarded. The isolated PBMCs were directly used for experiments or cryopreserved (RPMI 1640 + 40% FCS + 10% DMSO) until further use for experiments.
A549 cell culture
Before chip seeding, A549 cells (adenocarcinomic human alveolar basal epithelial cell line; CCL-185, ATCC®) were grown in cell culture flasks containing DMEM/Ham’s F12 medium (Biowest, USA) supplemented with 5% FCS at 37°C, 5% CO2 and 90% relative humidity. A549 cells were routinely passaged every 3-4 days using Accutase® (PELOBiotech, Germany) and used for chip seeding at passage 49.
Three-Dimensional CoSeedis™ Cell Culture of A549 cells
Five days before starting the co-culture experiment, A549 were seeded in 3D CoSeedis™ chips following the Multi-Organoid in chip Technology™ standard protocol (abc biopply AG, Switzerland). A549 cells were seeded at a cell density of 200 cells per microcavity (cpm, 20 000 cells/mL) according to the Multi-Organoid in chip Technology™ standard protocol20. The next day, chips were transferred into new 6-well plates with fresh medium and A549 spheroids were grown for 5 days before using them in organ-to-organ co-culture experiments (sandwich co-culture).
Three-Dimensional CoSeedis™ Cell Culture of PBMCs
One day before starting the co-culture experiment, cryopreserved PBMCs were thawed, resuspended in RPMI 1640 cell culture medium (Biowest, USA) supplemented with 15% FCS and 1% Pen/Strep (BioConcept, Switzerland) were seeded into the 3D CoSeedis™ chips according to the Multi-Organoid in chip Technology™ standard protocol20. PBMCs were seeded at a cell density of 600 cpm (60 000 cells/mL) and aggregates were left to maturate for 16 h before starting the sandwich co-culture.
Sandwich co-culture of PBMCs and A 549 tumoroids
3D CoSeedis™ chips containing PBMCs (matured for 16 h) were transferred to a new 6-well plates. A549 3D CoSeedis™ chips (matured over a period of 5 days) were transferred on the top of the PBMCs chips, thus directly initiating this so-called sandwich co-culture experiments according to the Multi-Organoid in chip Technology™ complex protocol20. The cell culture medium was not changed for the duration of the experiment, i.e. 24 hours. Single culture samples of PBMCs, and A549 were used as controls. After 24 hours of co-culture, PBMCs were harvested from the 3D CoSeedis™ chips according to the Multi-Organoid in chip Technology™ standard protocol20, and cell viability was determined by cell counting with Trypan Blue (Gibco, USA). PBMCs were cryopreserved (RPMI 1640 + 40% FCS + 10% DMSO) until further analysis. Microscopic images from all the samples were acquired at the beginning (0h) and at the end (24h) of the sandwich co-culture experiment using a Zeiss Axio Observer.Z1 microscope (Zeiss, Germany).
D CoSeedis™ in chip viability assay
Cell viability of A549 tumoroids at the beginning (0h) and end (24h) of the sandwich co-culture experiment was assessed according to the 3D CoSeedis™ in chip viability assay protocol20. Plates were sealed with a transparent sealing foil before measuring luminescence on a GloMax® Explorer Multimode Microplate Reader (Promega, USA).
PBMC sample preparation and UVB irradiation before High-performing single-cell gel electrophoresis (4D Lifetest™)
For high-performing single-cell gel electrophoresis sample preparation was done according to the 4D Lifetest™ standard protocol (4D Lifetec AG, Switzerland). Specifically, PBMCs that were cryopreserved after the sandwich co-culture experiments were thawed with warm fresh cell culture medium (RPMI 1640 + 15% FCS + 1% P/S), centrifuged for 8 min at 300 x g and resuspended in 500 µL cell culture medium. Cells were counted, and viability was determined with trypan blue staining (Gibco, USA). Cell suspensions were prepared in fresh cell culture medium with a concentration of 105E+05 cells/mL. From every sample, 100 µL were transferred to a separate well of a 96-well plate (Greiner Bio-One, Austria). Low melting agarose (0.5 %, Carl Roth GmbH & Co., Germany) was melted and 100 µL per sample transferred to a separate well of a 96-well plate at 38 °C in a Digital Dry Bath (D1302-230V, Labnet International, USA). Cells were transferred to fresh wells in the heated 96-well plate and agarose added in a 1:4 volume to volume ratio (final concentrations of 0.4 % agarose and 42 cells / µL). The cell-agarose mixture was then pipetted onto two 4D Lifeplates™ (4D Lifetec AG, Switzerland). The control 4D Lifeplate™ was dried for 2 min at 5 °C and directly placed into a pre-cooled lysis solution (pH 10, 2.5 M NaCl, 100 mM EDTA, 1 % Sodiumsarcosinate, 1 % Triton X-100, all from Sigma-Aldrich and 10 mM TRIS, from Melford Laboratories, UK) at 5C. The other 4D Lifeplate™ was dried for 1 min at 5 °C and then irradiated with UVB (312 nm) 0.16 J/cm2 dimmed 7 % in a UV Irradiation chamber BS-02 (Opsytec Dr. Gröbel, Germany). Both, the control 4D Lifeplate™ as well as the irradiated 4D Lifeplate™ were lysed for 1 h in the lysis solution at 5C.
High-performing single-cell gel electrophoresis (4D Lifetest™)
High-performing single-cell gel electrophoresis was performed using the 4D Lifetest™ according to the 4DC-05212-LC-P Instructions for use 4D Lifetest™ Lung Dx (4D Lifetec AG, Switzerland) and as described in Cassano et. al. 202035. Briefly, upon lysis, 4D Lifeplates™ were rinsed three times with deionized water (Milli-Q, Millipore, Switzerland) prior to gel electrophoresis. Gel electrophoresis was done in the 4DLifetank™ (4D Lifetec AG, Switzerland) with 30 min unwinding at 4 °C and 40 min electrophoresis at 4 °C and 1.1 V / cm. Afterwards, the 4D Lifeplates™ were neutralized twice in 0.4 M Tris-Buffer (pH 7.5, Melford-Laboratories, UK) for 5 min. 4D Lifeplates™ were rinsed with deionized water and dehydrated in ethanol (Sigma-Aldrich, USA) for 10 min. 4D Lifeplates™ were dried completely before staining with 0.8 x SYBR™Gold nucleic acid stain (Thermo Fisher Scientific, Switzerland) solution in TAE-Buffer (30 mM, Melford-Laboratories, UK), 0.75 mM Na2EDTA x 2 H2O (Sigma-Aldrich, Switzerland) for 30 min shaking at 42 rounds / min (IKA™ KS 501 orbital shaker, Fisher Scientific, Switzerland) and destained twice with 1x destaining solution (abc Biopply AG, Switzerland) for 30min shaking at 42 rounds/min. Prior to image acquisition 4D Lifeplates™ were dried in the dark at room temperature.
Imaging of 4D Lifeplates™
Comets were imaged using a top-down fluorescence microscope (Olympus Life Sciences by Evident Europe GmbH, Germany), with a 10 x microscope objective and the C11440-42U30 orca-Flash 4.0 LT Plus digital camera (Hamamatsu Photonics K.K., Japan) using the CellSens Dimension Software version (Olympus Life Sciences by Evident Europe GmbH, Germany). Images were acquired as tiles to image all comets in every gel spot. Image tiles were converted to tiff files and analyzed manually with Andor Komet Software version 7 (Oxford Instruments, UK) and automatically with the 4D LifeAI™ version 1 (4D Lifetec AG, Switzerland / Fuse-AI GmbH, Germany). For each cell sample, two technical replicates were analyzed for the control and for the irradiated 4D Lifeplate™ respectively. For each technical replicate, 75 comets were scored manually and as many as possible automatically.
Data processing and statistics
Data processing and statistics related to the novel single cell gel electrophorese assay 4D Lifetest™ has been standardized and validated35. If not otherwise stated, a minimum of two experiments was performed each with two technical replicates (“spots”). In each spot a minimum of 100 comets were analyzed resulting in a total of minimum 200 comets per sample per experiment. For each spot, mean values and corresponding standard deviations were calculated (spot means). Subsequently, for each experiment the mean of the two spots was calculated (experimental mean). Finally, the mean value and the corresponding standard deviation of all experimental means was calculated (overall mean). The coefficient of variance (CV (%)) is given as a measure of variability and was calculated from (a) experimental means (generally three independently generated values) and (b) spot means (generally six values resulting from three independent experiments). Bar plots are generated from % DNA tail intensity values of 100 single comets contained in one spot. Median values, standard deviation, and coefficient variance (CV) % were calculated from % DNA tail intensity acquired from scored comets. For the comparison to clinical data sets the level of DNA damage was assessed both at the baseline level and after minimal exposure to UVB. DNA damage sensitivity (DDS) was calculated following a normalization to the baseline values (DTN) by subtracting the unexposed values from the irradiated values.
Results
Establishment of PBMC aggregates in 3D CoSeedis™ Multi-Organoid Model
To assess tumor exposure on DNA stability in peripheral blood mononuclear cells (PBMCs) using the 3D CoSeedis™ Multi-Organoid Model, we established a robust and reproducible protocol to aggregate and culture PBMCs in the 3D CoSeedis™ chip throughout the experimental period. The morphology and viability of PBMC aggregates, normally maintained in suspension, were evaluated at 24, 48, and 72 hours following seeding into the 3D CoSeedis™ Chip880 (abc biopply, Switzerland) (Figure 1). This time frame was selected because the duration required for the sandwich co-culture experiments to elicit measurable effects on PBMC DNA integrity was initially uncertain. However, a period of 72 hours was considered sufficiently long to capture potential effects without compromising the viability of PBMCs in culture. PBMCs formed small multicellular aggregates lacking well-defined, compact boundaries. This morphological appearance was evident as early as day 1 and remained unchanged for up to 4 days. Over this time frame, no morphological indications of cell proliferation or cell death were observed (Figure 1). Although some cell loss occurred during the seeding procedure—particularly during transfer of the chip into new 6-well culture plates—this did not adversely affect PBMC aggregate formation or overall cell viability.
Figure 1. Morphology of PBMC aggregates in 3D CoSeedis™. Representative microscopic (brightfield) images showing the morphology of PBMCs aggregates (600 cpm) within the 3D CoSeedis™ chips at each respective time point (24, 48 and 72 hours) after cell seeding and at 2 different magnifications (5x and 20x). Scale bars: 500 µm (upper images) and 100 µm (lower images).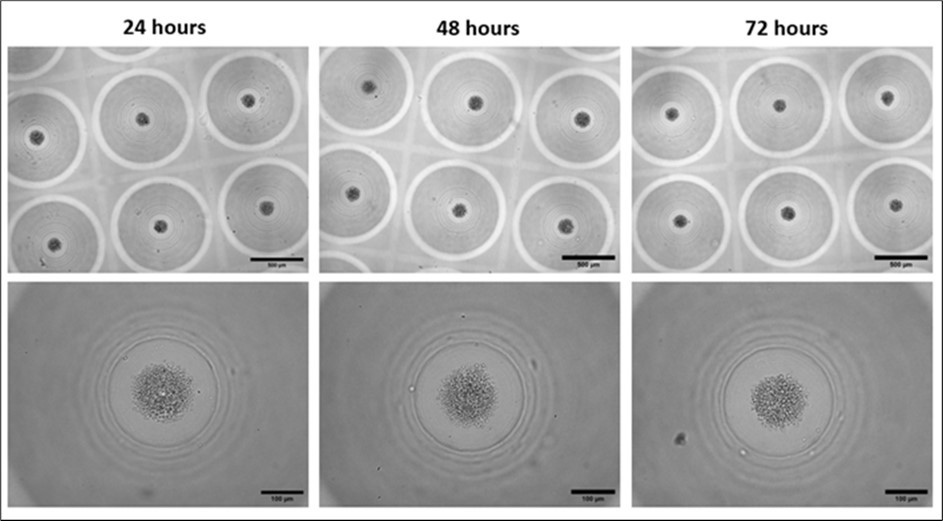
Download figure
The 3D CoSeedis™ Multi-Organoid Model provides the first in vitro system that enables the aggregation and maintenance of PBMCs, making these cells accessible for complex in vitro disease modeling and opening the door to the presented sandwich co-culture technology. Furthermore, the model allows for the adaptation and optimization of medium, serum, and other components required for subsequent sandwich co-culture experiments, as well as the exchange of soluble factors between organ components, enabling the formation of a microenvironment encompassing both cell populations.
Sandwich co-cultures of A549 tumoroids and PBMC aggregates
The non-small cell lung cancer (NSCLC) cell line A549 was used to generate tumoroids in the 3D CoSeedis™ Multi-Organoid Model and to serve as an in vitro tumor model to investigate DNA integrity in primary human PBMCs upon tumor exposure. 2D expanded A549 cells showed the expected cell morphology for this cell line (data not shown), with a doubling time of 28 hours in culture. Tumoroids were generated in the CoSeedis™ Chip880 (abc biopply AG, Switzerland) by seeding A549 cells at a density of 200 cpm. Tumoroid maturation occurred over a period of 5 days prior to the initiation of co-culture experiments with PBMCs. 16 hours after seeding, A549 cells formed loosely clustered aggregates, which subsequently matured into three-dimensional tumoroids with clear and well-defined borders over the five-day culture period (Figure 2A). For this experiment, PBMCs were seeded into the CoSeedis™ Chip880 and allowed to form small cell aggregates overnight (16h) (Figure 2B). These PBMC aggregates were used directly for subsequent sandwich co-culture experiments.
Figure 2. Morphology of A 549 cell line tumoroids and PBMCs aggregates within 3D CoSeedis™ chips before chip stacking for sandwich co-culture experiment. Representative microscopic (brightfield) images showing the morphology of (A) A 549 tumoroids (200 cpm) 16 hours and 5 days after cell seeding and before chip stacking for sandwich co-culture experiments and (B) PBMCs aggregates (600 cpm) 16 hours after cell seeding and before chip stacking for sandwich co-culture experiments, at 2 different magnifications (5x and 10x). Scale bars: 500 µm (upper images) and 200 µm (lower images).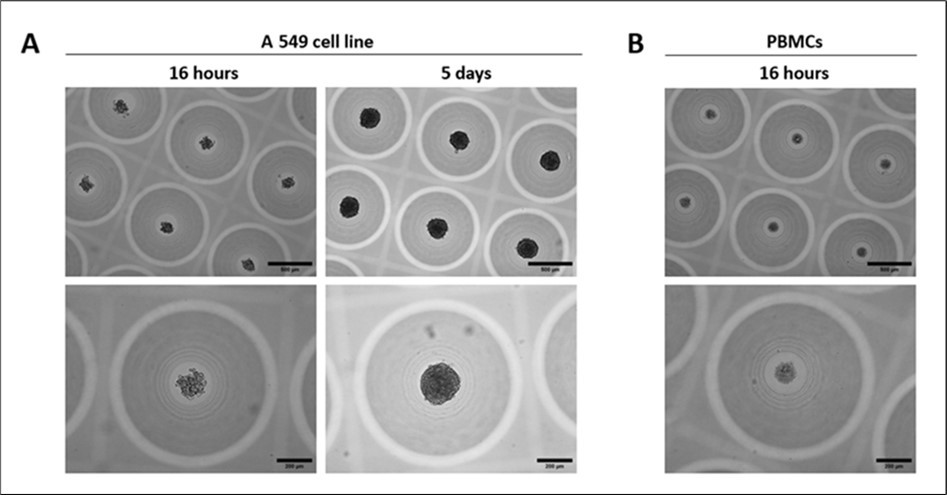
Download figure
Sandwich co-cultures of A549 tumoroids and PBMC aggregates were established by stacking chips containing A549 tumoroids onto chips containing PBMC aggregates (see Figure 3C for experimental setup). Mono-culture conditions of A549 tumoroids and PBMC aggregates were included as controls. Cell morphology was monitored for all conditions over a 3-day period (24, 48, and 72 hours). No morphological changes were observed in either cell type, and no differences were detected between co-cultured and mono-cultured tumoroids or PBMC aggregates, respectively (Figure 3A and B). The pH of the cell culture medium remained stable throughout the experiment. Therefore, no medium exchange was performed, and the composition of the conditioned medium remained unchanged over the entire experimental period. A549 tumoroids exhibited a slight increase in size over the 3-day observation period under both monoculture and sandwich co-culture conditions. In contrast, the size of PBMC aggregates remained unchanged over time (Figure 3B).
Figure 3. Morphology of A 549 cell line tumoroids and PBMCs aggregates within 3D CoSeedis™ chip before and during the sandwich co-culture experiment. Representative microscopic (brightfield) images showing the morphology of A 549 tumoroids (200 cpm) and PBMCs aggregates (600 cpm) at different time points (24, 48 and 72 hours) either under mono-culture condition (A 549 alone and PBMCs alone) or sandwich co-culture condition (co-culture A 549 and co-culture PBMCs) at lower magnification (5x) (A) and higher magnification (20x) (B). (C) Schematic setup of the sandwich co-culture configuration used in this study. (D) Experimental setup defining sample and control time points. 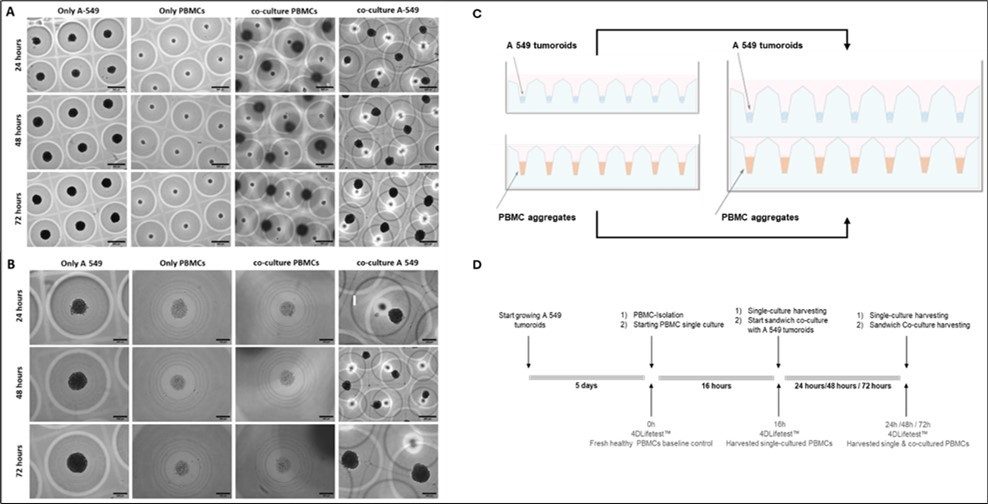
Download figure
Viability in mono- and sandwich co-cultures
Morphological criteria were not sufficient to determine the optimal duration for tumoroid-PBMC exposure. Therefore, the viability of both cell populations over a period of four days (24, 48, and 72 hours) was investigated using the 3D CoSeedis™ Cell Viability in chip Assay20. In this assay, cell viability is directly proportional to intracellular ATP levels and detected via a luciferase-based reporter assay. Cell viability was expressed either as relative luminescence units (RLU; Figure 4A) or as percentage of non-stacked control (Figure 4B). A slight increase of 20% in cell viability of monocultured A549 tumoroids cultured for 72 hours is observed (Figure 4). This increase is expected given the in vitro proliferation rate of approximately 28 hours. In addition, there were no significant differences between monocultured A549 tumoroids and those in sandwich co-culture. Likewise, cell viability of PBMCs in monocultures were comparable to their counterpart in sandwich co-cultures. Absolute RLU values for PBMCs are generally lower than corresponding tumoroid values due to a lower number of seeded cells and the non-proliferating character of those cells in vitro. Likewise, normalized cell viability in monoculture conditions (Figure 4B) showed a slight increase in signal for A549 tumoroids (due to cell proliferation; bright orange bars), whereas no change was observed for PBMC aggregates (non-dividing cells; bright blue bars). In contrast, normalization to non-stacked control (Figure 4B, dark orange and blue, respectively), show no effect of co-culture conditions on cell viability.
Figure 4. 3D CoSeedis™ Cell Viability in chip Assay. Cell viability was measured using the CoSeedis™ Cell Viability in chip Assay (abc biopply AG, Switzerland) and luminescence was measured at different time points (24, 48 and 72 hours) after the sandwich co-culture experiment was started. For co-culture conditions, cell viability of each cell type was measured separately. Luminescence at each time point represents the integrated signal derived from 880 A549 tumoroids or 880 PBMC aggregates, respectively, cultured under the indicated conditions. (A) Cell viability values expressed in relative luminescence units (RLU) for each sample, without normalization. (B) Cell viability values expressed in percentage non-stacked control (%) to show cell viability over time: the mono-culture A549 and PBMC values are normalized to their respective 24-hours sample; the A549 and PBMC co-culture values are normalized to the corresponding monoculture samples at each time point, respectively, to show possible difference between mono- and co-culture condition. Note: The samples/measurements for cell viability (RLU) at 48 hours for PBMCs in co-culture were omitted due to lower-than-expected cell number of total PBMCs available at the start of the experiment.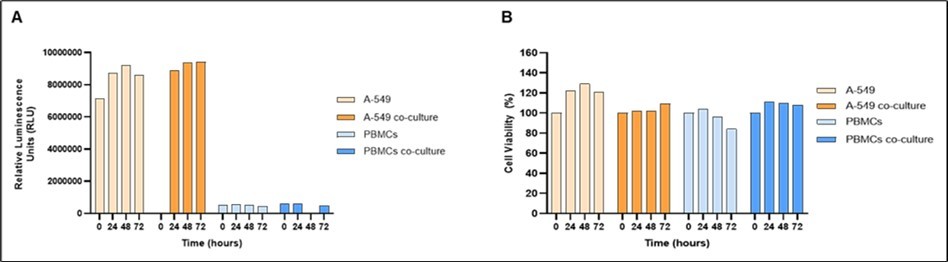
Download figure
Sandwich co-culture did not cause any detectable changes in tumoroid morphology or reduce cell viability. Based on these results, culture conditions for both human primary PBMC aggregates and A 549-derived tumoroids were considered suitable for downstream analysis using the 4D Lifetest™. Furthermore, the maintenance of high cell viability across all experimental conditions further suggests that co-culture–associated DNA fragmentation due to nonspecific cytotoxicity is unlikely. Likewise, sandwich co-culture experiments employing the non-cancerous MRC-5 cell line (derived from human embryonic fibroblasts) in place of A549 showed no effect on DNA fragmentation in co-cultured PBMCs, indicating that the observed phenomenon is not a nonspecific consequence of in vitro co-culture conditions (data not shown). Collectively, these findings support the suitability of the 3D CoSeedis™ Multi- Organoid Sandwich Co-Culture System as an in vitro model to investigate tumor-associated effects on PBMC DNA integrity.
4D Lifetest™ DNA Fragmentation Analysis (DDS)
At each respective time point (24, 48 and 72 hours), PBCMs cultured in mono- or sandwich co-cultures with A549 tumoroids were harvested according to the Multi-Organoid in chip Technology™ Standard Protocol20. Single-cell suspensions of PBMCs from each sample were cryopreserved and later used in the 4D Lifetest™ to analyze DNA fragmentation (Figure 5).
Figure 5. 4D Lifetest™ DNA Fragmentation Analysis (DDS) over time of sandwich co-culture. Schematic representation of experimental setup of the 4D Lifetest™ (A). DNA fragmentation in PBMCs was measured at 0h (after seeding), 16h (0h sandwich co-culture) and 24h mono- and sandwich co-culture, respectively. (B) Fragmentation was visualized using SYBR™ Gold nucleic acid stain and measured as a percentage of fluorescent intensity in the tail vs. total. Representative fluorescent intensity graphs of tail fragments are shown in the upper panels (corresponding Comet Assay images in the lower panel). (C) DDS effect on PBMCs 24, 48, and 72 hours after sandwich co-culturing with lung cancer (LC) tumoroids. Control depicts DTN of PBMCs from a healthy donor before freezing to verify that the cells survived transport without impact on DNA fragmentation. Patient H046 control shows DNA fragmentation after thawing but before culturing. 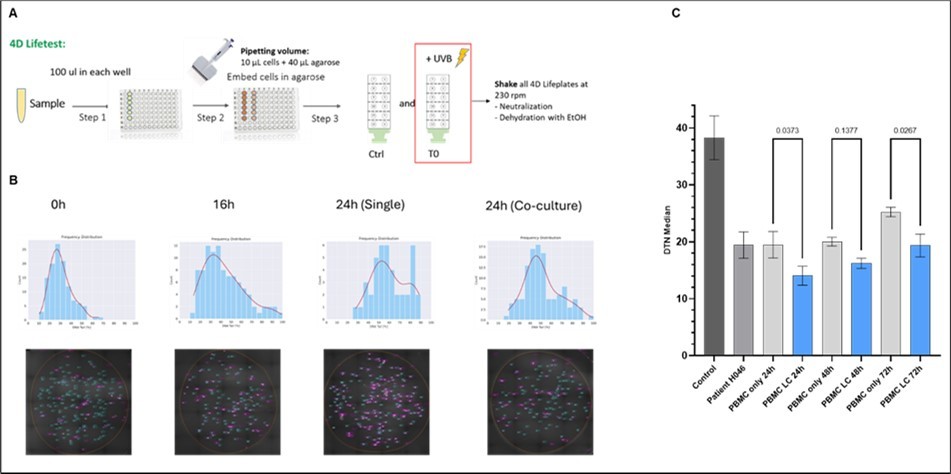
Download figure
The 4D Lifetest™ DNA Fragmentation Analysis provides a quantifiable novel genetic marker for DNA stability and fragmentation (DDS). To ensure comparability between different experiments and donors, DDS values are normalized against baseline fragmentation (unirradiated, untreated sample; see section 2.7 of Materials and Methods) to account for donor age and other background effects, expressed in DTN. Lower DTN values thereby indicate higher DNA fragmentation levels and vice versa. The experimental setup is depicted in Figure 5A. At each time point, one 4D Lifeplate™ was either lysed directly for comet analysis (unirradiated) or exposed to UV radiation for a defined period of time prior to lyses to induce DNA fragmentation. Tumor exposure was reported to reduce DNA repair capacity and consequently lead to increased DNA fragmentation after UV induced DNA damage 36. Panel (B) from Figure 5 shows exemplary SYBR™ Gold stained nuclei of PBMCs after cell lysis (lower panels). Increasing numbers of comet tails is directly correlated with the duration of sandwich co-culturing. This is reflected by the corresponding frequency of the fluorescent intensity in the graphs above (Figure 5B, upper panel). Longer sandwich co-cultures result in higher frequencies, signifying more fluorescent intensity in comet tails, hence higher DNA fragmentation. Figure 5C shows that exposing PBMCs from a healthy donor (H046) to a lung cancer tumoroid in the CoSeedis™ 3D Multi-Organoid Model has a significant effect on DTN values, compared to PBMCs in monoculture (unexposed to cancer, control). This effect is not affected by the duration of the sandwich co-culture and remains stable for 48 hours. After 72 h of sandwich co-culture, there is a slight increase of the DTN value of monocultured PBMCs that may indicate some long-term culture effects (ageing) on DNA fragmentation. However, the statistical relevance between the 48 hours and the 72-hour time points remains unchanged and the observed effect in DTN reduction stays constant. Since the DTN signal was maximal at 24 h and remained stable at least up to the 48 h time point paired with unaltered cell viability of PBMCs, we decided to look at the 24 h time point only for the main experiment. This will include the model specific, statistically relevant amplifications of data points of the clinical, biological, experimental, and technical replicas (Figure 6, Figure 7, and Figure 8).
To assess the impact of tumor exposure on DNA integrity and genomic stability in PBMCs in a statistically relevant setup and to compare the predictiveness of the in vitro model and the clinical study results for lung cancer, cells from four healthy donors were analyzed. PBMC aggregates were either co-cultured with A549 tumoroids for 24 hours or maintained under tumor-free culture conditions for the same duration. Following this exposure period, both PBMC populations were harvested from the 3D CoSeedis™ chips and subsequently analyzed. A total of 32 repetitions were performed with 4 donors. Moreover, each 3D CoSeedis™ chip presents 880 clonal replicates per culture condition (Figure 6). PBMCs at 16 h served as the baseline for this cell population prior to tumor exposure. The 24 h mono-culture controls (“alone”, Figure 6) represents PBMCs that were never exposed to tumoroids but kept in culture for the same duration as sandwich co-cultures equivalents. Tumoroids were harvested and snap-frozen either after 16h (PBMCs) or 24h after mono- or sandwich co-culture (PBMCs alone and co-cultured).
Figure 6. Scheme of the experimental setup. PBMCs from healthy donors were seeded onto 3D CoSeedis™ chips. For each donor, 12 CoSeedis™ chips were seeded (4 replicates per condition). Three different conditions were evaluated: PBMCs in monoculture for 16h; PBMCs monoculture for 24h hours; and PBMCs in sandwich co-culture for 24h with A549 tumoroids. PBMCs were seeded and 16h later, 4 chips were harvested to perform the 4DLifetest™, and the remaining chips were transferred into a new plate. 4 chips containing PBMCs were kept in single culture conditions, while the remaining 4 chips were co-cultured with A549 tumoroids for 24h. After 24h, all the PBMCs (both in monoculture and sandwich co-culture) were harvested, frozen, and DNA fragmentation was assessed via 4D Lifetest™. After every replication (amplification) step, a T-test was performed to determine the statistical probability (p-values).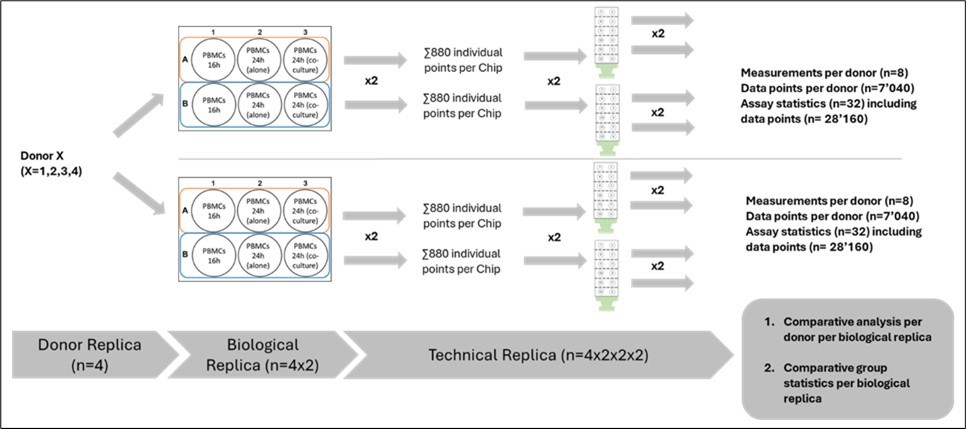
Download figure
The experimental set-up depicted in Figure 6 shows the influence of donor replica, biological replica and technical replica on assay statistics. Repetitive experiments were performed to confirm general test results (not included for statistical analysis; data not shown). Briefly, PBMCs from 4 different donors were cultured in 2 biological replicas, each providing 880 aggregates and tumoroids communicating with each other leading to a total of 7’040 datapoints per donor. These aggregates were subsequently leading to 4 technical replicas in the 4D Lifetest™ totaling 28’160 overall data points in the assessment of DNA fragmentation. The influence of this amplification of accessible datapoints on assay sensitivity and predictiveness is shown in Figure 7. Even though the impact of lung tumor cells on PBMC DNA fragmentation was detectable at all levels of statistical complexity starting at the donor replica level (Figure 7, panel A), the experimental setup demonstrates increasing statistical relevance and sensitivity with increasing numbers of data point analyses per condition. Statistical relevance was clearly improved when biological as well as technical replicas were added in the analysis (panel B and C).
Figure 7. Influence of statistical relevance by data point amplification on assay sensitivity and predictiveness. The figure shows the %DNA tail values for each time point and after each statistical amplification step of the experiment. Displayed p-values based on unpaired t-test analysis. (A) Assay sensitivity based on donors’ replicates (n=4) only; (B) Assay sensitivity based on donor and biological in vitro replicates including amplification of aggregates using the Multi-Organoid in chip Technology™ (n=7’040); (C) Assay sensitivity based on donor, biological in vitro and technical 4D Lifetest™ replicates including the 4D Lifeplate™-based amplification of aggregates (n=28’160).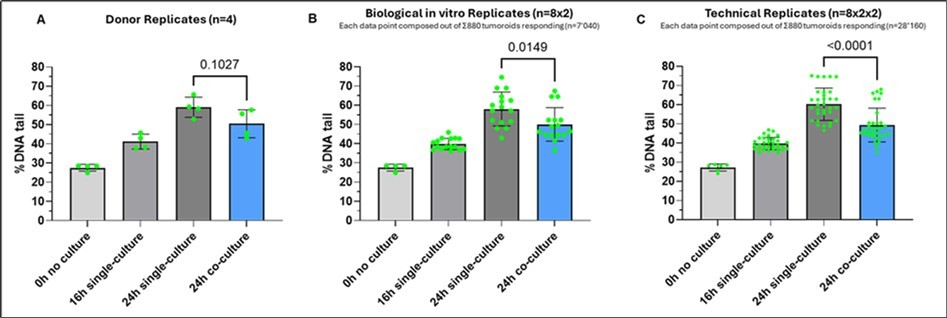
Download figure
Finally, the predictive capacity of the 3D CoSeedis™ Multi-Organoid Model was evaluated as a novel in vitro approach to detect DDS in tumor-exposed PBMCs. To this end, data obtained from the 4D Lifetest™ as shown in Figure 7 were compared with results derived from PBMCs of healthy (n=20) and cancer patients (n=25) that were directly analyzed using the same assay (Figure 8). In both cases, the in vitro derived PBMC aggregates as well as in the patient-derived samples, sensitivity reached more than 95%. The comparison revealed not only that the model was capable to replicate the results observed in patients, but also that the order of magnitude of the response was in the same range. Furthermore, ROC plots confirmed high sensitivity with high specificity for both, in vitro as well as clinical samples.
Figure 8. Evaluation of the in vitro predictive capacity of the 3D CoSeedis™ Multi-Organoid Model. (A) The graph illustrates the DTN values (%DNA tail after UVB exposure normalized to baseline values) of the in vitro experiment (n=32) and clinical study samples derived from 20 healthy donors and 25 lung cancer patients. Bar plots depict median values, with whiskers indicating the standard deviation. Assay sensitivity is compared using the p-values based on unpaired t-test analysis; (B) ROC curve illustrates the sensitivity and specificity of sandwich co-culture experiments; (C) ROC curve illustrates the sensitivity and specificity of clinical study results. 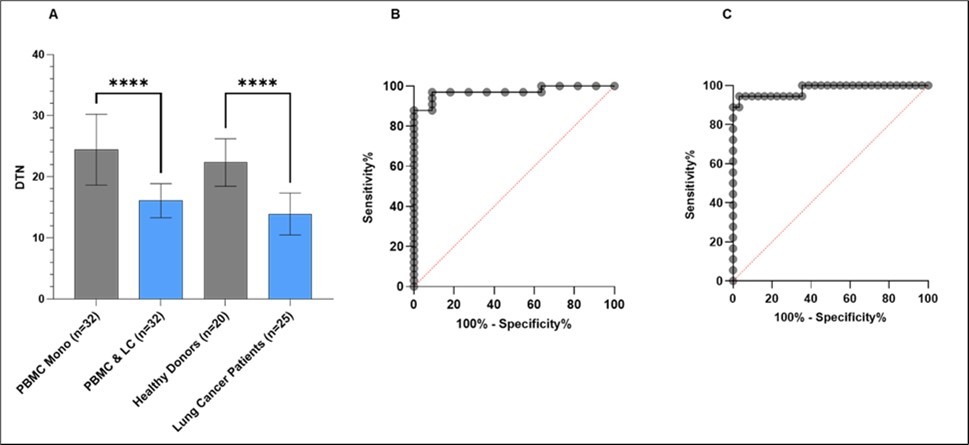
Download figure
Discussion
The identification of reliable early biomarkers for cancer remains highly challenging, particularly when restricted to non-invasive approaches that avoid additional physiological burden, prolonged recovery, or further compromise already vulnerable patients. In this context, the identification of PBMCs DNA fragmentation as a proportional and quantifiable biomarker (DDS) indicative of tumor presence represents a substantial advancement. Although the clinical observation of DDS is promising, it has remained inconclusive whether PBMCs DNA fragmentation is directly attributable to the presence of tumor tissue or indirectly mediated through systemic inflammatory responses. The objective of the present study was to determine whether the effects reported in multiple clinical case studies arise from direct intercellular communication between tumor cells and PBMCs rather than from secondary systemic immune reactions. In addition, this work introduces a novel in vitro assay designed to recapitulate complex in vivo communication processes under standardized and reproducible conditions. The high physiological relevance of the 3D CoSeedis™ Multi-Organoid Model is attributed to the intrinsic self-organization of its ECM tumor microenvironment. This approach facilitates the identification, validation, and classification of novel, quantifiable cancer biomarkers and may enable the assessment of their potential as powerful tools in diverse applications.
The results presented in this work show that the 3D CoSeedis™ Multi-Organoid Model is a powerful tool to recapitulate complex in vivo interactions. The model reproduces PBMC DNA fragmentation patterns observed in lung cancer patients in clinical studies with comparable sensitivity and magnitude. This unprecedented predictive power is based on the high scalability of the 3D CoSeedis™ Multi-Organoid Model enabling the generation of statistically robust datasets for biomarker identification, supporting its application as an early-stage model in drug discovery, and contributing to the reduction of animal use. Cell viability assays indicate that the model remains stable over time, with no evidence of substantial cell death. Consistently, initial assessment of DDS demonstrated that the biomarker was readily detectable and maximal after 24 hours of sandwich co-culture and remained stable for at least 48 hours. In the absence of any immune cells in the tumor microenvironment, this finding strongly indicates that the observed effect of lung tumor cells on DNA fragmentation in PBMCs is caused by a direct intercellular signal and not due to systemic inflammatory reactions. Furthermore, it also underscores the usefulness of DDS as a direct quantitative indicator for cancer, hence defines a sensitive and accurate new genetic marker in tumor medicine. At 72h of sandwich co-culture, a modest increase in normalized DTN values was observed (Figure 5). This increase may reflect effects associated with cellular aging under culture conditions. However, given the absence of measurable changes in cell viability over the same period, this effect is unlikely to be attributable to cell death. Furthermore, DNA fragmentation resulting from cell death was only observed when PBMC viability decreased below 70% (data not shown). Based on these findings, subsequent DNA fragmentation analyses were performed after 24 hours of sandwich co-culture. Statistical robustness of the assay was further evaluated using PBMCs from four independent donors, comprising two biological replicates and four technical replicates per donor (n = 32). In total, more than 28,000 data points were analyzed. This stepwise amplification of replication was associated with improved assay sensitivity and enhanced predictive performance. The unprecedented scalability in statistical power related to biological function is unique to the 3D CoSeedis™ Multi-Organoid Model and cannot be achieved in alternative 3D systems nor in vivo models (see Figure 7). The presented study also clearly shows that the 3D CoSeedis™ Multi-Organoid Model and the Multi-Organoid in chip Technology™ are an ideal system to describe complex in vivo interactions. In a comparative study, we demonstrated that the sandwich co-culture approach not only mimics the in vivo situation but reaches similar levels of sensitivity and specificity. Moreover, this new approach shows the same magnitude in response to tumor exposure as do PBMCs from cancer patients.
Conclusion
In summary, the 3D CoSeedis™ Multi-Organoid Model represents a novel in vitro platform for detecting PBMC DNA fragmentation (DDS) following tumor exposure and establishes DDS as a sensitive, direct biomarker of tumor presence driven by tumor–PBMC communication rather than systemic inflammation. The model successfully reproduces in vivo–like DNA fragmentation patterns observed in lung cancer patients with high sensitivity and statistical robustness, while its scalability and stability enable reproducible biomarker validation and support applications in drug discovery.
These findings position DDS as a promising non-invasive, broadly applicable cancer-associated biomarker and highlight the model’s potential to accelerate research across multiple cancer types without relying on time-consuming and costly clinical studies. In addition, the platform offers a valuable approach for real-time, personalized cancer drug development by allowing evaluation of drug efficacy—and its impact on PBMC DNA fragmentation—directly in patient-derived samples during clinical trials.
References
- 2.Arrowsmith J, Miller P. (2013) . Trial Watch: Phase II and Phase III attrition rates 2011-2012.Nature Reviews Drug Discovery.12 569 10-1038.
- 3.Unger C. (2014) Modeling human carcinomas: Physiologically relevant 3D models to improve anti-cancer drug development.Advanced Drug Delivery Reviewsvol. 79, 50-67.
- 5.Dhandapani M, Goldman A. (2017) Preclinical Cancer Models and Biomarkers for Drug Development: New Technologies and Emerging Tools.J. , Mol.Biomark.Diagn 08.
- 6.Breslin S, O’Driscoll L. (2013) Three-dimensional cell culture: The missing link in drug discovery.Drug Discovery Todayvol. 18, 240-249.
- 7.Ricci C, Moroni L, Danti S. (2013) Cancer tissue engineering- new perspectives in understanding the biology of solid tumours- a critical review.OA Tissue Engineering1.
- 8.S A Langhans. (2018) Three-dimensional in vitro cell culture models in drug discovery and drug repositioning.Frontiers in Pharmacologyvol. 9, 10-3389.
- 9.Sharma K, Dey S, Karmakar R, A K Rengan. (2023) A comprehensive review of 3D cancer models for drug screening and translational research. Cancer Innovation.
- 12.Norman G A Van. (2019) Limitations of Animal Studies for Predicting Toxicity in Clinical Trials: Is it Time to Rethink Our Current Approach?JACC Basic Transl. Sci.4.
- 13.A. (2019) Lost in translation: the valley of death across preclinical and clinical divide – identification of problems and overcoming obstacles.Transl. , Med. Commun.4
- 15.S A Langhans. (2021) Using 3D in vitro cell culture models in anti-cancer drug discovery.Expert Opinion on Drug Discoveryvol. 16.
- 16.K V, C S Rutland, A, V. (2020) Cell Culture Based in vitro Test Systems for Anticancer Drug Screening.Frontiers in Bioengineering andBiotechnology 8.
- 17.Belfiore L. (2021) Generation and analysis of 3D cell culture models for drug discovery.European. , Journal of Pharmaceutical Sciencesvol 163.
- 18.L P Ferreira, V M Gaspar, J F Mano. (2018) Design of spherically structured 3D in vitro tumor models -Advances and prospects.ActaBiomaterialiavol. 75, 11-34.
- 19.E C Costa. (2016) 3D tumor spheroids: an overview on the tools and techniques used for their analysis.Biotechnology Advancesvol. 34.
- 21.A R Thomsen. (2018) A deep conical agarose microwell array for adhesion independent three-dimensional cell culture and dynamic volume measurement.Lab Chip18.
- 22.J M Waldschmidt. (1045) Ex vivo propagation in a novel 3D high-throughput co-culture system for multiple myeloma.J. Cancer Res. Clin. Oncol.148
- 23.Rocha S. (2021) Immunophenotype of Gastric Tumors Unveils a Pleiotropic Role of Regulatory T Cells in Tumor Development. 10-3390.
- 24.Voglstaetter M. (2019) Tspan8 is expressed in breast cancer and regulates E-cadherin/catenin signalling and metastasis accompanied by increased circulating extracellular vesicles.Journal of Pathology.248.
- 25.Rocha S. (2019) . 3D Cellular Architecture Affects MicroRNA and Protein Cargo of Extracellular Vesicles.Advanced Science6 .
- 26.Voloshin T. (2020) Tumor treating fields (Ttfields) hinder cancer cell motility through regulation of microtubule and acting dynamics.Cancers. 12, 1-18.
- 27.J M Waldschmidt. (2022) Ex vivo propagation in a novel 3D high-throughput co-culture system for multiple myeloma.J. Cancer Res. Clin. Oncol.148 1045-1055.
- 28.V O Oria. (2018) Proteome Profiling of Primary Pancreatic Ductal Adenocarcinomas Undergoing Additive Chemoradiation Link ALDH1A1 to Early Local Recurrence and Chemoradiation Resistance.Transl. Oncol.11 1307-1322.
- 29.A P Masilamani. (2020) An anti-psma immunotoxin reduces. mcl-1 and bcl2a1 and specifically induces in combination with the bad-like bh3 mimetic abt-737 apoptosis in prostate cancer cells.Cancers (Basel).12 1-15.
- 30.Strand Z. (2023) Establishment of a 3D Model to Characterize the Radioresponse of Patient-Derived Glioblastoma Cells.Cancers (Basel).15.
- 31.Sargenti A. (2023) Adipose Stromal Cell Spheroids for Cartilage Repair: A Promising Tool for Unveiling the Critical Maturation Point.Bioengineering.10.
- 32.O E Arcadu, M P Leu, A R Thomsen, Faisst. (2023) A.-C.Opening New Horizons. in Humanizing Preclinical Multi-Organoid Disease Models with the 3DCoSeedisin Chip Communication Technology .
- 33.Godau J. (2021) Early detection of breast cancer by liquid biopsy exploiting the DNA damage sensitivity (DDS).Presented at the European Society for Medical Oncology CongressPreprint at.
- 34.A R Thomsen. (2022) Early-stage diagnosis of lung cancer with liquid biopsy test based on peripheral blood cells.Presented at the European Lung Cancer CongressPreprint at.