
A New Spectrofluorimetric Approach for The Quantitation of Imipramine Hcl in Commercial Dosage Forms
Abstract
A spectrofluorimetric method has been developed for the determination of imipramine HCl in bulk and commercial dosage forms. The method was based on measuring the fluorescence emission intensity of imipramine-eosin Y ion pair complex (λem = 558 and λex = 319) in dichloroethane at buffer solution (sodium acetate and acetic acid) of pH 4.8. The stoichiometric ratio between imipramine and eosin Y was studied by Job's method of continuous variations and found to be 2:1. Formation constant (Kf) and Gibb’s free energy change (ΔG) were calculated and pointed towards the spontaneous nature of the reaction. A series of variables were studied to optimize the reaction conditions. The proposed method was validated as per ICH guidelines and successfully applied for the determination of active imipramine HCl in commercial dosage forms with high degree of accuracy and precision.
Author Contributions
Academic Editor: kaustuv sahoo, Oklahoma State University
Checked for plagiarism: Yes
Review by: Single-blind
Copyright © 2017 Syed Najmul Hejaz Azmi, et al.
 This is an open-access article distributed under the terms of the Creative Commons Attribution License, which permits unrestricted use, distribution, and reproduction in any medium, provided the original author and source are credited.
Competing interests
The authors have declared that no competing interests exist.
Citation:
Introduction
Imipramine hydrochloride is chemically known as 5-3-(dimethylamino)propyl-10,11-dihydro-5H-dibenzbf-azepine monohydrochloride (Chemical Abstract Service: 113-52-0; Molecular Weight: 316.88). The drug is a dibenzazepine derivative of tricyclic antidepressant, competitively blocks the reuptake of norepinephrine and serotonin in synapses in brain 1. The drug is prescribed in the treatment of psychiatric patients suffering from depression. The drug has many variety of side effects which include drowsiness, convulsions, respiratory disorders, ophthalmoplegia, and finally coma 2. Therefore, lower dosages of imipramine hydrochloride are recommended. The inactive ingredients of imipramine are calcium phosphate, cellulose compounds, docusate sodium, iron oxides, magnesium stearate, polyethylene glycol, povidone, sodium starch glycolate, sucrose, talc, and titanium dioxide. The drug is always administered orally. It is advisable to initiate treatment at a dose of 10-25 mg daily. Toxic-effects can be induced especially when overdosed and/or high-dose drugs is combined with alcohol 3. With increasing regulatory strictness, the quality, quantity and safety of imipramine can be maintained for obtaining optimum therapeutic concentration and for quality assurance in pharmaceutical formulations. The importance of analytical techniques involved in the quality control analysis of active drug in pharmaceutical formulations has been discussed in published papers 4, 5, 6.
Imipramine HCl is officially listed in British Pharmacopoeia 7 which describes a liquid chromatographic method for its assay in bulk and tablet forms. Several other analytical methods have been reported based on high performance thin layer chromatography 8, high performance liquid chromatography 9, 10, electrochemical analysis 11, 12, 13 and spectrophotometry 14, 15, 16, 17, 18, 19. Imipramine HCl is weakly fluorescent in nature and reagents such as erythrosine B in chloroform 20 and rhodamine B in ethylene glycol-distilled water medium 21 have been utilized for quantitative determination of active drug in pharmaceutical formulations by fluorescence spectrophotometry. Eosin Y is a xanthene polyprotic fluorescent acid dye which contains 2 acidic protons with pKa of 2 and 3.8 in water 22. Eosin Y is an interesting reagent for determination purposes because of the fluorescent and dianionic nature of the dye. Eosin Y has been used for determination of doxepin 23 and citalopram HBr 24. In this study, eosin Y acted as a fluorescent probe and formed fluorescent ion-pair complex with imipramine in the presence of sodium acetate-acetic acid buffer solution of pH 4.8. The complex was extracted in dichloroethane provided fluorescence emission intensity at 558 nm after excitation at 319 nm. As per literature survey and gathered information, there is no spectrofluorimetric method based on the extraction of complex in dichloroethane for quantitation of imipramine. Extraction in dichloroethane improved sensitivity and selectivity of the method. The reactions conditions are optimized and validated as per International Conference on Harmonisation guidelines (USA) 25.
Materials and methods
Apparatus
Fluorescence intensity and spectra were recorded on Thermo Scientific Agilent’s Cary Eclipse FluorescenceSpectrophotometer (Australia) equipped with a xenon 150 W arc lamp and 1-cm quartz cells. Excitation and emission wavelengths were set with slit widths of 5 nm. pH values were measured using Hanna pH meter (USA).
Materials
All reagents and solvents used were of analytical reagent grade. 0.03% eosin Y disodium salt (CAS: 17372-87-1, M.W.: 691.85, Fluka Chemie AG, Switzerland) solution was prepared by dissolving 0.03 g of eosin Y in 100 mL standard volumetric flask and diluted up to the mark with distilled water.
Walpole sodium acetate-acetic acid buffer solution of different pH (3.72-5.57) were prepared using different volumes of 0.2M sodium acetate and 0.2M acetic acid in a total volume of 10 mL 26.
Imipramine hydrochloride was purchased from Sigma-Aldrich (USA). 0.02% imipramine HCl solution was prepared by dissolving 0.02 g drug in 100 mL distilled water. Imipramine 25 (Actavis, UK) and imipramine HCl 25 (SGH, Singapore) were procured from SQU hospital (Oman) and Ibn Sina Hospital (Oman), respectively.
Procedure for the Determination of Imipramine Hydrochloride by Proposed Method
0.15-1.0 mL of 0.02% imipramine HCl and 2 ml of sodium acetate-acetic acid buffer solution of pH 4.8 were added with 1.6 ml of 0.03% eosin Y into 10 mL standard volumetric flask. The contents of the flask were diluted up to the mark with distilled water at 25±1 ̊C and transferred into a 100 mL separating funnel. 10 mL of dichloroethane was poured in the separating funnel and the contents of the funnel were thoroughly mixed for 2 min. 2 layers were formed and the dichloroethane layer was enriched with fluorescent ion-pair complex. The dichloroethane layer was separated and treated with anhydrous sodium sulphate (4g). The said layer was now subjected for recording fluorescence emission intensity at 558 nm after keeping excitation wavelength at 319 nm. The calibration graph was plotted and the linear regression equation was developed for the estimation of imipramine HCl in commercial tablets.
Procedure for the Determination of Imipramine Hydrochloride by Reference Method
Into a series of 10 mL standard volumetric flask, 0.2-0.5 mL of 0.02% imipramine HCl solution was taken and the solution was diluted up to the mark with distilled water at room temperature. The fluorescence emission intensity at 407 nm was measured after keeping excitation wavelength at 259 nm against distilled water as a blank. The calibration graph was constructed by plotting fluorescence emission intensity against the initial concentration of imipramine HCl. The linear regression equation was generated using Origin Pro6.1 software and utilized for quantitation of active imipramine in pharmaceutical formulations.
Procedure for the Determination of Active Imipramine Hydrochloride in Pharmaceutical Formulations by Proposed and Reference Methods
Ten tablets of Imipramine 25 (Actavis, UK) and imipramine HCl 25 (SGH, Singapore) were weighed and finely powdered using agate mortar and pestle. An amount of powdered tablets equivalent to 20 mg imipramine HCl was transferred in 100 mL beaker and dissolved in 50 mL of distilled water. The solution was passed through a filter funnel equipped with Whatmann No 42 filter paper in 100 mL standard volumetric flask. The residue on filter paper was washed with 4×10 mL portions of distilled water. The filtrate was diluted up to the mark with distilled water in 100 mL volumetric flask and finally cleaned using 0.45µm polyethersulfone membrane (Filter-Lab) using 5mL syringe. The recommended procedures were followed for the determination of active imipramine HCl in commercial dosage forms.
Results and Discussion
In the literature, it was reported that doxepin HCl 23 and citalopram HBr 24 possessed tertiary amine group. 2 acidic protons of carboxylic and phenolic group sites of eosin Y were ionized 22 forming dianionic eosin Y with strong green fluorescence (λexcitation =257.96 nm and λemission =544.02 nm). There was no extraction of eosin Y in organic solvent in the presence of buffer solution alone. Hence, 2 molecules of said protonated drugs were considered binding with carboxylic and phenolic group sites of eosin Y and extracted in chloroform/dichloromethane. Similarly, here in acidic condition (pH 4.8 buffer solution of sodium acetate-acetic acid), eosin Y ionized 2 acidic protons which was protonated to 2 molecules of imipramine through nitrogen as centre. Hence, dianionic eosin Y interacted with protonated imipramine and formed fluorescent ion pair complex (λem = 558 nm and λex = 319 nm). At the same time, dianionic eosin Y with acidic buffer solution (without imipramine) was not extracted in dichloroethane. The aqueous solution of imipramine HCl showed an emission wavelength of 407 nm after keeping excitation wavelength constant at 259 nm. The spectrofluorimetric spectra of aqueous imipramine, aqueous eosin Y and ion-pair complex were given in Figure 1.
Figure 1.Spectrofluorimetric spectra: 0.5 mL of 0.02% imipramine HCl in 10 mL volumetric flask and diluted up to mark with distilled water (a) λexcitation=259 nm and (b) λemission=407 nm; 0.5 ml of 0.03% eosin Y in 10 mL volumetric flask and diluted up to mark with distilled water (c) λexcitation=257.96 nm and (d) λemission=544.02 nm; 1 ml of 0.02% imipramine HCl + 1 mL of sodium acetate-acetic acid buffer solution of pH 4.8 + 1.6 ml of 0.03% of eosin Y in 10 mL volumetric flask and diluted up to mark with distilled water, then extracted in 10 mL dichloroethane (e) λexcitation=319 nm and (f) λemission=558 nm. Excitation wavelengths used to measure emission spectra and emission wavelengths used to measure excitation spectra.
The selectivity offered by fluorescence measurements is invaluable because of distinct excitation and fluorescence spectra and wavelengths available for each fluorophore 27. A further extremely important group of selective methods is based on the phenomenon of energy transfer. Self-quenching of aqueous eosin Y and even in sodium acetate-acetic acid buffer solution of pH 4.8 was not observed. Stokes shift was observed on the interaction of eosin Y with imipramine in the presence of sodium acetate-acetic acid buffer solution of pH 4.8 (Figure 1). This resulted in the resonance energy transfer from eosin Y to imipramine. The transition occurred from the interaction of the transition dipoles of eosin Y and imipramine groups.
The extraction equilibria can be represented as follows:
2HIM+ + E-2 (HIM2+ E-2)
(HIM2+ E-2) (HIM2E)o
where HIM+ and E-2 are protonated imipramine and di-anionic eosin Y, respectively, and the subscript o refers to the dichloroethane layer. The reaction sequence is shown in Figure 2.
Figure 2.Reaction sequence of the proposed method.
The stoichiometric ratio between imipramine and eosin Y for the ion pair complex was established by Job's method of continuous variations 28. In this method, identical molar concentration (6.31×10⁻⁴ M) of imipramine and eosin Y were mixed in varying volume ratios but the total volume of each mixture was same. The fluorescence emission intensity of each solution was recorded and plotted against the mole fraction of imipramine, imipramine / imipramine + eosin Y. The results obtained with this method resulted in the stoichiometric ratio between imipramine and eosin Y as 2:1. The formation constant (Kf) was calculated using the following expression 23, 24, 29:
 Eq.1
Eq.1
Where Fobs. and Fextp. are observed and extrapolated fluorescence emission intensities of the complex. CIM, CE and  are initial concentration of imipramine, eosin Y and limiting concentration (=CE) in mol L-1, respectively. The Kf of the associated complex was found to be 4.36×10¹². The apparent Gibbs free energy (ΔGº) was calculated using ΔGº = -2.303 RT log Kf and found to be -72.09 kJ mol-1. The high negative value of ΔGº provided strong evidence for the feasibility of the reaction.
Method Optimization and Validation
For the development and optimization of analytical method, certain validation parameters and experimental variables were investigated separately.
Optimization of Variables
The experimental variables such as reaction time, concentration of eosin Y, sodium acetate-acetic acid buffer solutions of different pH, volume of buffer solution at particular pH, extracting solvents and shaking time for extraction of complex were optimized with 20.0 mg mL-1 imipramine hydrochloride.
The effect of the reaction time was investigated. The maximum fluorescence emission intensity of the complex was achieved immediately and stable up to 1 h at 25 ± 1˚C. Therefore, the analysis can be performed within 1 h.
The influence of the volumes of 4.34 × 10⁻⁴ M eosin Y (0.03%) was studied. The maximum fluorescence emission intensity was obtained with 1.2 mL of 4.34 × 10⁻⁴ M eosin Y and remained constant up to 1.6 mL of 4.34 × 10⁻⁴ M eosin Y (Figure 3). Therefore, 1.4 mL of 4.34 × 10⁻⁴ M eosin Y was used as optimum volume of eosin Y for the analysis of active imipramine in commercial dosage forms.
Figure 3.Effect of the volume of 4.34×10⁻⁴M eosin Y on the fluorescence intensity of the imipramine-eosin Y complex.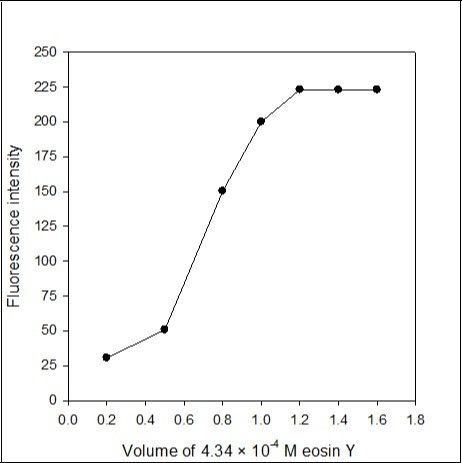
The effect of the pH of the aqueous phase on fluorescent ion-pair extraction was studied using sodium acetate-acetic acid buffer solutions over the pH range 3.72-5.57. The fluorescence intensity of dichloroethane extract was maximum and constant in the pH range 4.63-4.99. Above pH 4.99, the fluorescence intensity was decreased (Figure 4). Therefore, all fluorescence intensity measurements were made at pH 4.8 in the determination process.
Figure 4.Effect of sodium acetate-acetic acid buffer solution of different pH on the fluorescence intensity of the imipramine-eosin Y complex.
The effect of volume of sodium acetate-acetic acid buffer solution of pH 4.8 was examined in the range of 0.5-2.5 mL. The highest fluorescence intensity was obtained with 1.5 mL, later on remained constant (Figure 5). Therefore, 2.0 ml of pH 4.8 buffer solution was selected as an optimum volume for further measurement of fluorescence emission intensity in the determination process.
Figure 5.Effect of the volume of sodium acetate-acetic acid buffer solution of pH 4.8 on the fluorescence intensity of the imipramine-eosin Y complex.
The effect of the extracting solvent such as dichloroethane, dichloromethane, chloroform, hexane, ethyl acetate, and benzene was tested. The polarity of a solvent affects both the extraction efficiency and fluorescence intensity. There was no fluorescence intensity recoded in ethyl acetate, benzene and hexane. The fluorescence emission intensity of the blank solution was also recorded and found negligible in the solvent. The maximum fluorescence emission intensity was obtained using dichloroethane as extracting solvent (Figure 6). Therefore, dichloroethane was selected as the best extracting solvent for the determination procedure.
Figure 6.Effect of the solvent Y on the fluorescence intensity of the imipramine-eosin Y complex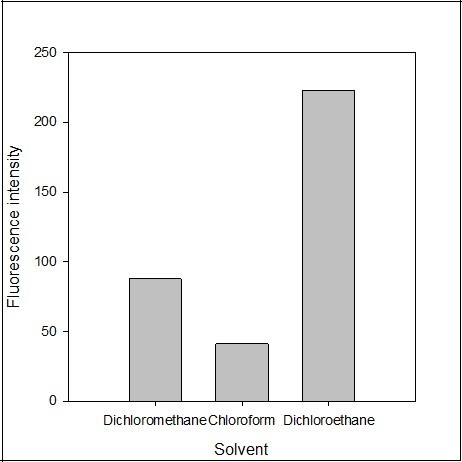
The effect of the shaking time from 0.5 to 3 min was investigated. The maximum fluorescence intensity of the complex was obtained at 1.5 min. The time acquired above did not produce any increase in fluorescence intensity. Therefore, the shaking time of 2.0 min was sufficient for the extraction of ion-pair complex into dichloroethane.
Validation
The fluorescence emission intensity of proposed method (or reference method) at 558 nm (or 407 nm) after keeping excitation wavelength constant at 319 nm (or 259 nm) of drug-eosin complex (or drug solution) was recorded and the linear regression equation was generated using OriginPro 6.1 software. The linear dynamic range of the proposed and reference methods were established and found to be in the range of 3.0 to 20.0 μg mL-1 (proposed method, n =8) and 4 to 10 μg mL-1 (reference method, n=7). The calibration data was treated with OriginPro 6.1 software to generate slope, intercept, standard deviation of intercept and slope, correlation coefficient, standard deviation of calibration line (So). Optical characteristics, linear regression equation and statistical data along with detection limit and quantitation limit are summarized in Table 1. The linearity of the regression line of the proposed was validated by high value of correlation coefficient (0.9999). Test of significance of intercepts, a, of regression lines (proposed and reference methods) showed that these did not differ significantly from the theoretical value, 0. For this, the quantity t- was calculated using the following equation 30:
t=a/sa Eq. 2
The value of t- were found to be 1.81 and 1.78 for proposed and reference methods, which were less than the tabulated t-value (2.447,  =6, proposed method) and (2.571, =5, reference method) at 95% confidence level. It confirmed that the calculated intercepts for the proposed and reference methods are not significantly different from 0. Hence, a significant relationship between the experimental fluorescence emission intensity and concentration of imipramine were existed for both methods. The proposed method’s procedure are free from procedural error and as much as effective as the reference method. The proposed method was suitable for the determination of active imipramine in commercial dosage forms.
| Parameters | Analytical methods | ||
| Proposed spectrofluorimetric method | Reference spectrofluorimetric method | ||
| Maximum wavelength (nm) | λem=558; λex=319 | λem=407; λex=259 | |
| Linear dynamic rang (µg mL-1) | 3-20 | 4-10 | |
| No. of concentration levels | 8 | 7 | |
| Linear regression equation | A= 0.36 + 11.13C | A= 0.29 + 4.39C | |
| Standard deviation of intercept, Sa | 0.199 (v=6) | 0.163 (v=5) | |
| Confidence limit of the intercept,±tSa | 0.486 | 0.418 | |
| Standard deviation of slope, Sb | 0.0154 | 0.0118 | |
| Confidence limit of the slope, ±tSb | 0.038 (v=6) | 0.030 (v=5) | |
| Correlation coefficient (r) | 0.999 (n=8) | 0.999 (n=7) | |
| Variance (So2) | 0.071 | 0.031 | |
| Standard deviation of calibration line (So) | 0.267 | 0.176 | |
| Limit of detection, LOD (µg mL-1) | 0.079 | 0.132 | |
| Limit of quantification, LOQ (µg mL-1) | 0.240 | 0.400 | |
Ideally the true relation between found and added concentration will provide straight line passing through the origin (intercept 0) with a slope equal to unity 31. Here, in the proposed method, the found concentration of imipramine (mg mL-1) differs slightly from added concentration of imipramine because of random fluctuations. The intercept and slope obtained by the proposed method were near to zero (5.4×10⁻⁴) and unity (1.0001). Hence the statistical theory of fitting straight line confirmed the previous conclusions for intercept. Therefore, the proposed method is free from determinate errors and suitable for the determination of active imipramine in commercial dosage forms.
Limits of detection (LOD) and quantitation (LOQ) were calculated according to the International conference on Harmonization guidelines 25. The low value of LOD (0.079 µg mL-1) and variance indicated good sensitivity of the proposed method.
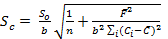
The statistical analysis of the calibration data was tested for calculating the error (Sc) in the determination of a given concentration of imipramine HCl using the following expression 32:
 Eq.3
Eq.3
Where  and
and  are average imipramine concentration and fluorescence emission intensity, respectively, for n standard solutions. The uncertainty in the determination of imipramine HCl over the linear concentration range was taken. The least error was observed at 11.41 mg mL-1 imipramine HCl.
| Excipients | ConcentrationM % | Tolerating volume (mL) | Fluorescence intensity | Tolerance amount (mg mL-1) | |
| Sucrosea | 0.01 | - | 1.0 | 223 | 3.42 |
| Povidone | - | 0.2 | 0.25 | 224 | 0.05 |
| Methyl cellulose | - | 0.2 | 0.25 | 222 | 0.05 |
| Starch | - | 0.1 | 0.25 | 221 | 0.025 |
| Poly ethylene glycol | - | 0.1 | 0.25 | 223 | 0.025 |
The precision of the proposed method was tested in terms of intraday (over a single day, n=5) and interday (over 5 consecutive days in a week, n=5) precisions at 3 concentration levels i.e. 4, 10 and 18 mg mL-1 imipramine HCl. The results are summarized in Table 2. The RSD values were in the ranges of 0.12-0.72 % for intraday and 0.15-0.59 % for inter day precisions. Table 3Satisfactory mean % recoveries (99.4 -100.25%) and low % RSD values for intraday and interday precisions at different concentrations confirmed high precision of the proposed method. Hence, the proposed method can be used to analyze imipramine HCl in commercial dosage forms.
Table 3. Intraday and interday precisions of the proposed method| Actual concentration (µg mL-1) | Intraday assay and interday precisions | |||||
| Measured concentration ±SD(µg mL-1) | RSDa% | Recovery,% | ||||
| Intraday | Interday | Intra-day | Inter-day | Intraday | Interday | |
| 4 | 3.95 ± 0.32 | 3.94 ± 0.26 | 0.73 | 0.59 | 98.75 | 98.5 |
| 10 | 10.02 ± 0.16 | 10.03 ± 0.11 | 0.14 | 0.10 | 100.2 | 100.3 |
| 18 | 17.96 ± 0.24 | 17.97 ± 0.31 | 0.12 | 0.15 | 99.78 | 99.83 |
The specificity and selectivity of the proposed method was investigated. The influence of foreign substances (sucrose, methyl cellulose, povidone, starch and polyethylene glycol) that can commonly accompany imipramine in pharmaceutical preparations was studied. Solution of imipramine (20 mg mL-1) and each said compound were mixed to obtain samples. The tolerance limit of each interfering substances was calculated as the maximum concentration yielding a relative error of ±2% at a concentration of imipramine HCl in the analytical signal. The tolerated amount of excipients at 20 mg mL-1 imipramine HCl was calculated using the following expressions:
Mass/Volume (g L-1 or mg mL-1) = Molar concentration × MW Eq. 4
where MW is the molecular weight of excipients.
Mass/Volume (g L-1 or mg mL-1) = Volume taken (mL) × % concentration Eq. 5
The results are summarized in Table 2. The method was tolerated variety of excipients, hence the proposed method is specific and selective, and can be used to determine active imipramine HCl in pharmaceutical preparations. This study also suggested that co-formulation substances are inactive ingredients and did not interfere in the determination of active imipramine in tablets.
The robustness of the proposed method was tested by deliberately changing the reaction conditions and studying the effect on the fluorescence intensity. The effect of varying volumes (1.4 ± 0.2 mL) of 4.34 × 10⁻⁴ M eosin Y, buffer solution of pH 4.63, 4.8 and 4.99, volumes (2± 0.5 mL) of buffer solution of pH 4.8, shaking time (2± 0.5 min) showed that these changes did not affect the percentage recovery of the drug. Results of variation in the experimental parameters were acceptable at room temperature, hence proved that the proposed method is robust.
Figure 7.Standard addition plot: 0.5 mL of 0.02% Tofranil solution was spiked with 0, 0.05, 0.1, 0.15 and 0.2 mL standard solution of 0.02% pure imipramine HCl.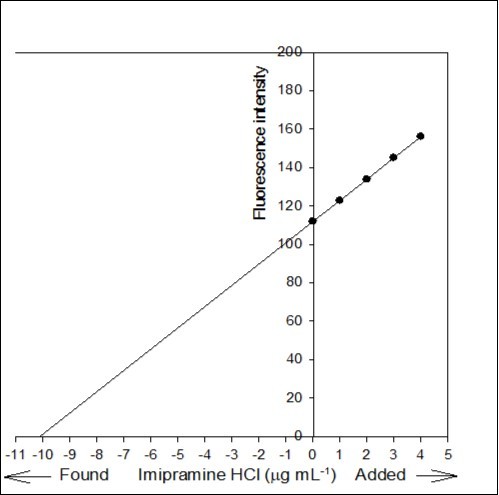
The accuracy of the proposed method was investigated by standard addition technique. A series of known amount of pure imipramine was spiked with constant amount of Tofranil solution and the fluorescence emission intensity of the associated complex was recorded. Standard addition plot was constructed using fluorescence emission intensity at y-axis and initial concentration of imipramine at x-axis (Figure 7). The regression line was generated with intercept and slope of 111.866 and 11.061, respectively. The amount of imipramine in Tofranil tablet was estimated either by dividing the intercept with slope or through extrapolation of the same line of best fit. The amount of imipramine in Tofranil tablet was found to be 10.114 µg mL-1. The statistical analysis of the calibration data was tested for calculating the error (Sc) in the determination of a given concentration of imipramine HCl by standard addition method using the following expression 33:
 Eq.6
Eq.6
The value of Sc was found to be 0.044 µg mL-1. The confidence limit for the concentration of imipramine in Tofranil tablet was calculated by Ci ± tSc34 at n - 2 degrees of freedom and found to be 10.114 ± 0.140 µg mL-1. The error is quite low, hence the method is accurate with acceptable recovery and precision.
Table 4. Significance of testing: Point and interval hypothesis tests for the determination of active imipramine HCl in tablets at 95% confidence level.| Dosage forms | Proposed method | Reference method | t-valueb | F-valueb | θLc | θUc | ||
| Recovery (%) | RSDa(%) | Recovery (%) | RSDa (%) | |||||
| Imipramine HCl 25 (SGH) | 100.11 | 0.36 | 100.16 | 0.23 | 1.09 | 2.28 | 0.989 | 1.004 |
| Imipramine HCl 25 (Actavis, UK) | 99.96 | 0.235 | 99.94 | 0.50 | 1.37 | 1.75 | 0.99 | 1.008 |
The applicability of proposed method for the determination of active imipramine HCl in Tofranil and Imipramine HCl tablets has been tested. Percentage recovery of active drug in tablets was estimated. The results of the proposed method were statistically compared with those obtained by the reference method and summarized in Table 4. It is clear from the table that the calculated t- and F values are less than the theoretical ones at 95% confidence level, indicated no significant difference between the methods compared.
Interval hypothesis test was also utilized to calculate bias and found to be within the acceptable range of ±2% 35 using the following quadratic equation.
 Eq.7
Eq.7
This quadratic equation in θ has two roots (θL and θU) provided θL and θU of 0.989 and 1.004, respectively in SGH imipramine tablets and 0.99 and 1.008, respectively in Actavis imipramine tablets. The results are acceptable and showed the compliance with regulatory guidelines 36.
Table 5. Comparison of the proposed spectrofluorimetric method with other published methods for the determination of imipramine HCl.| S.No. | Reagents/Mobile phase/Electrode | λmax (nm) | Linear range (μg mL-1) | Analysis time (min) | References |
| HPTLC | |||||
| 1 1 | Toluene: ethyl acetate: ethanol: diethanolamine (70: 15: 4: 1 v/v/v/v) | 288 | 5-9 | 30 | 8 |
| HPLC | |||||
| 2 2 | Mobile phase: Phosphate buffer (pH 3.4)-acetonitrile (55:45)Flow rate: 1.0 mL/min | 250 | 12.5-125 | 2.2 | 9 |
| 3 3 | Mobile phase: water (pH 6)-methanol-triethylamine (70:30:0.1 % v/v/v)Flow rate: 1.0 mL/min | 216 nm | 50-150 | 5.05 | 10 |
| Electroanalytical methods | |||||
| 4 4 | Amberlite-titanium dioxide nanoparticles modified glassy carbon paste electrode at pH 6 phosphate buffer (0.1M) | - | 0.0004-1.97 | Preprocessing time, approx. 24 h | 11 |
| 5 5 | Carbon nanocomposite electrode designed by montmorillonite nanoclayinto a carbon ionic liquid electrode | - | 0.63-12.68 | Preprocessing time, approx. 3 h | 12 |
| 6 6 | Graphite-polyurethane composite electrode | - | 0.10-0.73 | Preprocessing time, approx. 24 h | 13 |
| Flow injection spectrophotometry | |||||
| 7 7 | Methyl orange in water-dichloroethane medium + universal buffer (pH) | 425 | 0.79-25.3 | Preprocessing time, approx. 3 h | 14 |
| Spectrophometry | |||||
| 8 | Drug was alkalinized with ammonia and extracted in chloroform. The drug solution was heated at 70°C using water bath for removing chloroform. The residue was dissolved in acetonitrile and reacted with 2,3-dichloro-5,6-dicyano-p-benzoquinone | 460 | 10-60 | Preprocessing time 1h | 15 |
| 9 | Drug + ammonium metavanadate + 10M sulphuric acid | 620 | 0.6–40 | 30 min | 16 |
| 10 | Drug + eriochrome cyanine R. Extracted in n-butanol | 520 | 10-80 | 5 min | 17 |
| 11. (a) | Drug + ammonium peroxidisulfate + 10M phosphoric acid | 658 | 10-110 | 35 min | 18 |
| (b) | Drug + niobium(V) thiocyanate + 10M sulphuric acid. Extracted in n-butanol-chlorofrom (9:1) medium | 350 | 0.8–8 | 7 min | 18 |
| 12. (a) | Drug + bromothymol blue + sodium acetate-HCl buffer solution of pH 2.8. Extracted in chloroform | 415 | 2.5-25 | 5 | 19 |
| (b) | Drug + bromophenol blue + sodium acetate-HCl buffer solution of pH 2.5. Extracted in chloroform | 415 | 3.0-25 | 5 | 19 |
| (c) | Drug + bromocresol green + sodium acetate-HCl buffer solution of pH 3.5. Extracted in chloroform | 415 | 2.5-25 | 5 | 19 |
| (d) | Drug + bromocresol purple + sodium acetate-HCl buffer solution of pH 2.5. Extracted in chloroform | 415 | 2.5-25 | 5 | 19 |
| (e) | Drug + I2, reacted in dichloroethane | 366 | 2.5-25 | 5 | 19 |
| (f) | Drug + KMnO4 + 0.45 M NaOH | 610 | 3.0-25 | 5 | 19 |
| Spectrofluorimetry | |||||
| 13 | Erythrosine B in water-chloroform medium + acetate buffer (pH 5) | λex = 544λem= 560 | 0.12-2.8 | Preprocessing time, approx. 3 h | 20 |
| 14 | Rhodamine B in ethylene glycol-distilled water medium | - | 0.1-20.0 | 10 | 21 |
| This work | Drug + Eosin Y + sodium acetate-acetic acid buffer solution of pH 4.8. Extracted in dichloroethane | λem = 558 and λex = 319) | 3.0-20 | 2 | Proposed method |
Conclusions
A comparison of the proposed method with those of published reported methods was presented in Table 5. It is clear from the table that so many analytical methods have been published but required analysis time of more than 2 min (analysis time of proposed method). HPLC technique is high enough but their related method’s linear dynamic range were broader 9, 10 as compared to proposed method. Hence discussed HPLC methods are less sensitive for trace analysis of active imipramine. Electroanalytical methods were time consuming required high pre-processing time 11, 12, 13. It can be seen from the table that so many published spectrophotometric methods are sensitive but suffered disadvantages of using oxidant + H2SO416, H2SO418, oxidant + H3PO418, oxidant + NaOH 19. The proposed method is simple, selective and economical with advantage of using commonly available fluorescent dye i.e. eosin Y. Therefore, the proposed method can be used as an alternative method in academic institutions, hospitals and pharmaceutical industries for routine quality control analysis of active imipramine HCl in pharmaceutical formulations and biological fluids.
Acknowledgements
The authors are thankful to Dean, Heads of Applied Sciences and Chemistry Section, Higher College of Technology, Muscat, Oman for the facilities. The authors are grateful to to the higher-up of the Ministry of ManPower (Higher College of Technology) Muscat, Sultanate of Oman for support to carry out this work.
References
- 1.Goodman. (2010) Gilman’s The Pharmacological Basis of Therapeutics, 12th edition. , McGraw-Hill, New York
- 2.G W Kerr, A C McGuffie, Wilkie S. (2001) Tricyclic antidepressant overdose: a review. , Emerg. Med, J 18, 236-241.
- 3.Tanaka E, Nakamura T, Terada M, Honda K. (2007) An in vitro study on the interaction between ethanol and imipramine at high concentrations using human liver microsomes. , Forens. Toxicol 25, 96-99.
- 4.M R Siddiqui, Z A Al-Othman, Rahman N. (2017) Analytical techniques in pharmaceutical analysis: a review.Arabian J.Chem. 10: S 1409-S1421.
- 5.Z A Al-Othman, Rahman N, M R Siddiqui. (2017) Review on pharmaceutical impurities, stability studies and degradation products. , Rev. Adv. Sci. Eng 2, 155-166.
- 6.Rahman N, Azmi S N H, H F Wu. (2006) The importance of impurity analysis in pharmaceutical products: an integrated approach. , Accred. Qual. Assur 11, 69-74.
- 8.S P Gupta, Upmanyu N, Garg G. (2012) Development and validation of spectrophotometric, HPTLC and HPLC methods for the determination of imipramine and chlordiazepoxide in pharmaceutical dosage forms. , Der Pharmacia Sinica 3, 185-192.
- 9.Vemula V R B, P K Sharma. (2013) Analytical method development and validation for simultaneous estimation of imipramine and diazepam in tablet dosage form by RP-HPLC. , Int. J. Pharm. Pharm. Sci 5, 249-253.
- 10.Chauhan P P, D Y Patel. (2016) Optimization of stability indicating RP-HPLC method for the estimation of an antidepressant agent’s alprazolam and imipramine in pure and pharmaceutical dosage form. , Eurasian J. Anal. Chem 11, 101-113.
- 11.B J Sanghvi, A K Srivastava. (2013) Adsorptive stripping voltammetric determination of imipramine, trimipramine, desipramine employing titanium dioxide as nanoparticles and an amberlite XAD-2 modified glassy carbon paste electrode. , Analyst 138, 1395-1404.
- 12.Eslami E, Farjami F, P A Azar, M S Tehrani. (2014) Adsorptive stripping voltammetric determination of imipramine and amitriptiline at a nanoclay composite carbon ionic liquid electrode. , Electroanalysis 26, 424-431.
- 13.R A De-Toledo, M C Santos, Shim H, L H Mazo. (2015) Electroanalytical Determination of imipramine in reconstituted serum with a graphite-polyurethane composite electrode. , Int. J. Electrochem. Sci 10, 6975-6985.
- 14.Pérez-Ruiz T, Martinez-Lozano C, Sanz A, Alonso C. (1994) Flow injection extraction spectrophotometric determination of imipramine in pharmaceuticals with methyl orange. , Talanta 41, 1523-1527.
- 15.Abde1-Salam M, A S Issa, Mahrous M, M E Abdel-Hamid. (1985) Spectrophotometric determination of some tranquillizers and antidepressants using 2,3-dichloro 5,6-dicyano-p-benzoquinone. , Anal. Lett 18, 1391-1403.
- 16.Misiuk W. (2000) Spectrophotometry assay of imipramine and desipramine using ammonium metavanadate and its application to pharmaceutical preparations. , J. Pharm. Biomed. Anal 22, 189-196.
- 17.Starczewska B. (2000) Spectrophotometric studies and application of imipramine-eriochrome cyanine R system for determination of imipramine in pharmaceuticals. , J. Pharm. Biomed. Anal 23, 383-386.
- 18.Misiuk W, Kleszczewska E, Karpinska J. (2001) Spectrophotometric determination of imipramine hydrochloride using ammonium peroxidisulfate and niobium(v) thiocyanate complex. , Anal. Lett 34, 201-209.
- 19.Susmitha K, Thirumalachary M, Vinod Kumar T, Venkateshwarlu G. (2013) Spectrophotometric determination of imipramine HCl in pure and pharmaceutical forms. , Der Pharma Chemical 5, 271-279.
- 20.Pérez-Ruiz T, Martinez-Lozano C, Tomas V, Sidrach C. (1995) Automatic extraction-spectrofluorimetric method for the determination of imipramine in pharmaceutical preparations. , Analyst 120, 1103-1106.
- 21.Dembinski B, Szydlowska-Czerniak A, Kurzawa M. (1998) Spectrofluorimetric determination of imipramine hydrochloride. , Acta Poloniae Pharmaceutica 55, 339-344.
- 22.Majek M, Filace F, A Jacobi von Wangelin. (2014) On the mechanism of photocatalytic reactions with eosin Y. , Beilstein J. Org. Chem 10, 981-989.
- 23.Rahman N, Siddiqui S, Azmi S N H. (2009) Spectrofluorimetric method for the determination of doxepin hydrochloride in commercial dosage forms. , AAPS PharmSci Tech 10, 1381-1387.
- 24.Azmi S N H, Al-Fazari A, Al Badaei M, Mahrezi R. (2015) Utility of eosin Y as a complexing reagent for the determination of citalopram hydrobromide in commercial dosage forms by fluorescence spectrophotometry. , Luminescence 8, 1352-1359.
- 25.. International Conference on Harmonisation, ICH Harmonised Tripartite Guideline- Text on Validation of Analytical Procedures(1996). Federal Register 61, 9315.
- 26.Britton H T S. (1942) Solutions of known hydrogen ion concentration, In: Hydrogen Ions, Volume I, Chapman and. , London 305.
- 28.D A Skoog, F J Holler, S R Crouch. (2007) Chapter 14: Application of ultraviolet-visible molecular absorption spectroscopy In:. Principles of Instrumental Analysis, 6th ed. Thomson-Brooks, Cole 385-386.
- 29.Khan F Lutfullah, Rahman N, Azmi S N H. (2012) Utilization of mesna as a complexing reagent and determination of Ni(II) by spectroscopic methods. , Adv. Sci. Lett 10, 61-71.
- 30.. VV Nalimov.(1963)The Application of Mathematical Statistics to Chemical Analysis,Pergamon Press,Oxford; 167.
- 31.Mandel J, F J Lining. (1957) Study of accuracy in chemical analysis using linear calibration curves. , Anal. Chem 29, 743-749.
- 32.Mendham J, R C Denney, J D Barnes, Thomas M. (2002) Statistics: Introduction to Chemometrics, sixth ed. Vogel’s Textbook of Quantitative Chemical Analysis, Pearson Education , Singapore 137.
- 33.J C Miller, J N Miller. (1993) Errors in instrumental analysis; regression and correlation,” In: Statistics for analytical chemistry, Third edition, Ellis Horwood and Prentice Hall. , England 119.
Cited by (6)
This article has been cited by 6 scholarly works according to:
Citing Articles:
Syed Najmul Hejaz Azmi, Zayana Nasser Al-Masrouri, Ibtisam Rashid Al-Lamki, Afrah Khamis Al-Jabri, N. Rahman et al. - Journal of King Saud University - Science (2022) Semantic Scholar
Journal of King Saud University - Science (2022) OpenAlex
Journal of King Saud University - Science (2022) Crossref
Yaver Subasi, G. S. Kanberoglu, F. Çoldur, Osman Cubuk, M. Zahmakiran - Chemické zvesti (2022) Semantic Scholar
Chemical Papers (2022) OpenAlex
Chemical Papers (2022) Crossref
Syed Najmul Hejaz Azmi, Aisha Al-Mahroqi, Khoula Al-Mamari, Shaima Al-Shukaili - Journal of new developments in Chemistry (2018) Semantic Scholar
Journal of new developments in Chemistry (2018) OpenAlex