Abstract
It was, previously, reported that the specific pattern of the compositional features of particular human-mouse orthologs defining in human two clusters, named C2 and C5, are present in different clusters in mouse. Since, thus, these orthologs can harbor a significant number of nucleotide differences a large sample of human-mouse orthologs having in human the C2 and C5 compositional features were collected in order to identify the orthologs that have been conserved or diverged during speciation. From the collection, 945 and 1051 orthologs had in human the C2 and C5 profile, respectively, while in mouse only 77 and 125, respectively, had these profiles. We further analyzed whether or not the frequency-usage of trinucleotides having the same gross composition computed from the reading of all nearest-neighbors of the DNA sequence might convey a layer of biological information in terms of chromosomal topology and function. In human, more than 50% of the C2 and C5 genes were found distributed in six chromosomes and preferentially located in GC-rich bands of chromosomes 11, 16 and 19. It was, also, found that 80% of the entire set of genes of band 19p13.3 had the C2 and C5 profile. The data shown also indicate that the proteins codified by the C5 genes have a bias towards nucleus and cytoplasm and specific post-translational modifications while the proteins codified by the C2 genes are mainly located in the cellular membrane or secreted to the external cellular milieu and particular post-transcriptional modifications
Author Contributions
Academic Editor: Saber Abd-Allah, Shanghai Institute of Biochemistry and Cell Biology, CAS, China
Checked for plagiarism: Yes
Review by: Single-blind
Copyright © 2016 Miguel A. Fuertes, et al
 This is an open-access article distributed under the terms of the Creative Commons Attribution License, which permits unrestricted use, distribution, and reproduction in any medium, provided the original author and source are credited.
Competing interests
The authors have declared that no competing interests exist.
Citation:
Introduction
Several studies have revealed that chromosomal gene-clusters are common in eukaryotic species1, 2 and that various mechanisms may be responsible for their formation leading to levels of organization that range from small to large ones. The occurrences of chromosomal clusters may entail that clustering confers some type of selective advantage suggesting that evolutionary mechanisms exists to promote their formation and maintenance3. There may be a link between the compositional, the chromosomal and the functional clustering since genes in chromosomal clusters could belong to common metabolic pathways, codify for proteins that may form interactive networks or serve as ligands and receptors in signaling pathways2, 4. Classically, gene-clusters have been obtained on the basis of expression data and the biological knowledge has been a posteriori used to make the most of the clusters. However, gene-clustering on the basis of expression data alone allows isolating co-expressed, -but not necessarily- biologically coherent units5, 6 being these strategies insufficient to bring out all potential relationships amongst genes7. Several methods have been described to cluster genes that correlate with biological information8, 9, 10. Recently, without previous knowledge of gene function and expression data a gene-clustering methodology was described by analysis of the similarities and differences among distinct sectors of genes independently of the reading frame and sequence homology10. The method computes the frequency-usage of 14 items, called composons. A composon is defined as a set of nucleotide triplets with identical gross composition containing as elements all nearest neighbors of each nucleotide of the DNA sequence. The data obtained revealed features of kinship or lack thereof that heretofore had not been recorded. In human the orthologs analyzed could be assigned to 11 clusters while in mouse they could be clustered to only 9 clusters. None of the mouse orthologs analyzed from the sample had the compositional profiles of the human genes from clusters 2 (C2) and 5 (C5)10.
In order to analyze whether in mouse there were not orthologs that in human have the C2 and C5 profiles we collected a large sample of human-mouse orthologs that in human had the C2 and C5 profiles. To check whether the composon-clustering may carry biological information the connection between composon-clustering and the chromosomal and functional clustering of the human C2 and C5 orthologs was evaluated. We found that a large number of C2 and C5 orthologs are distributed in six chromosomes, that they are preferentially located in the GC-rich bands of chromosomes 11, 16 and 19 and that 80% of the entire set of genes of 19p13.3 have the C2 and C5 profiles. The proteins codified by the C5 genes have a bias towards nucleus and cytoplasm and specific post-translational modifications while proteins codified the C2 genes are mainly located in the cellular membrane or secreted to the extracellular milieu. The data suggest that from the reading of DNA sequence the composon-clustering may convey useful biological information, providing, therefore, a new perspective to the study of the problem of annotation of protein function.
Materials and Methods
Triplet Composon-Usage Calculation
We will consider that a set of triplets, as for example, TTC, CTT, TCT, CCT, TCC and CTC will have the same “gross composition” if it contains all nearest neighbor combinations of the bases C and T. This set of triplets would form the triplet composon <CT>. Thus, a triplet composon (hereafter named composon) would be defined as a set of nucleotide triplets with the same “gross composition”.
The composon-usage frequency was determined starting the reading of the coding sequence (CDS) at any letter of the original triplet and moving from triplet-to-triplet to the end of the sequence so that the reading was done in a fully overlapping way. To do that, the application COMPSEQ from The European Molecular Biology Open Software Suite (EMBOSS) was used http://emboss.bioinformatics.nl/. The parameters of the application were a word size of 3 (a triplet) and a frame of word to look at 0, i.e. the sequence is read in a fully overlapping way. The application will compute all nearest neighbors of each nucleotide along the DNA sequence. Then, they were grouped into composons by their frequency use10. The composon-usage frequency was obtained by summing up the frequency use of each one of the triplets that constitute a composon. The usage-frequencies of the 14 composons were tabulated as per thousand (‰).
The methodology of k-means clustering was used to cluster genes into C2 and C510, 11. The composon-usage frequency was the parameter used for clustering. The "distance function" was the Pearson correlation coefficient (r) that measures the strength and the direction of the linear relationship between the n =14 pairs of values of the two variables xi and yi which represent the composon usage frequencies of the two sequences to be compared. The coefficient is, then, the best estimate of the correlation of xi and yi and it is written as:
A cut-off threshold of r2≥0.900 was chosen. This value ensures a potential close link between all the CDSs fitting into C2 and C5.
As baseline the expected composon-usage frequency from very long pieces of randomized DNA having each the same number of the A, T, C and G nucleotides, was used. In such random sequences each triplet appears with an expected frequency of 15.6 ‰. Composons containing sets of six nucleotide triplets appear with an expected frequency of 93.6 ‰, as reported10. Table 1 provides a summary of all individual composons generated by their associated sets of nucleotide triplets.
Table 1. Summary of all individual composons and their associated sets of nearest-neighbor base triplets| BASES | sets of DNA-tripletsa | COMPOSONb |
| A | AAA | <A> |
| G | GGG | <G> |
| T | TTT | <T> |
| C | CCC | <C> |
| A,G | AGA, GGA, AGG | <AG> |
| GAG, GAA, AAG | ||
| A,C | ACA, CCA, ACC | <AC> |
| CAC, CAA, AAC | ||
| A,T | ATA, TTA, ATT | <AT> |
| TAT, TAA, AAT | ||
| G,T | GTG, TTG, GTT | <GT> |
| TGT, GGT, TGG | ||
| C,G | CGC, GGC, CGG | <CG> |
| GCG, CCG, GCC | ||
| C,T | TCT, TCC, CCT | <CT> |
| CTC, TTC, CTT | ||
| A,G,C | GAC, CAG | <AGC> |
| AGC, CGA | ||
| ACG, GCA | ||
| A,G,T | GAT, TAG | <AGT> |
| AGT, TGA | ||
| ATG, GTA | ||
| A,C,T | CAT, TAC | <ACT> |
| ACT, TCA | ||
| ATC, CTA | ||
| T,C,G | CTG, GTC | <TCG> |
| TCG, GCT | ||
| TGC, CGT |
Correspondence between composon-usages and nucleotide-usages
If the usage-frequency of a particular composon, as for example the composon <AC>, is denoted by x<AC> and the number of each nucleotide (A, C, G and T) in the DNA sequence is denoted by the

parameters NA, NC, NG and NTrespectively, then:
If we assume that each one of the indexes i, j, k take the values of A, G, T or C then, the last four expressions can be written in a compact form as:
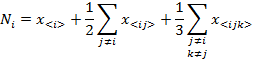 (5)
(5)
The estimated length of the DNA sequence N would, then, be:
 (6)
(6)
Figure 1 illustrates the calculus of Ni. Figure 1A shows the composon-usage frequencies found for the CDS of the human gene KIF13A with a length of 5274 base pairs (accession number AJ291578). Equation 5 was applied to the composon-usages obtained to estimate the number of nucleotides of the DNA sequence in order to compare it with the real number of nucleotides (see Figure 1B and the insert). As can be observed, the error is less than 0.5% for a sequence of this length. Figure 1C shows, however, that the error observed increases as the length of the DNA sequence decreases, being higher than 1.5% for lengths lower than 100 base pairs. The knowledge of the error in the estimation of nucleotide composition is necessary in order to know the minimum length to be considered for the election of the gene sample. It should be noted that the estimated length of the gene analyzed, using equation 6, is identical to the real length of the gene.


(1-4)
Figure 1.Plots representing the composon-usage frequencies and the estimated nucleotide content of a DNA sequence. Gen KIF13A: (A) Calculated composon-usage profile. (B) The real (white) and the estimated (black) nucleotide content of the gene by using equation 5. The inset shows the numeric values and errors of the observed and estimated nucleotide content and the length of the gene by using equations 5 and 6. (C) The estimation of the standard errors in the nucleotide content by using equation 5 was calculated from the composon-usages of DNAs of different sizes.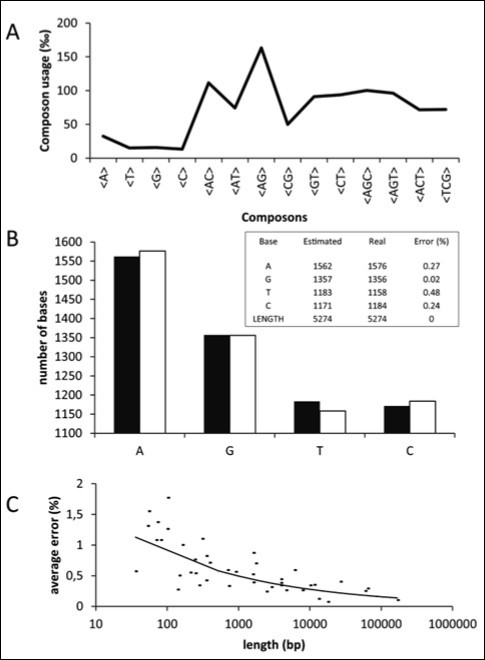
Human-mouse sample collection criteria
For the CDSs to be included in the human-mouse sample some criteria were kept. First, the human CDSs were collected following the random sample selection criterion. Second, each one of the randomly selected human CDSs has to display a C2 or and C5 composon-usage profile10. Third, the randomly selected human CDSs having the C2 and C5 profile must have orthologs in mouse. The selected mouse orthologs were, then, included into the human-mouse orthologs collection. Finally, as indicated above CDSs shorter than 100 base pairs were eliminated from the analysis. All sequences analyzed in this study were obtained from The National Center for Biotechnology Information DNA database (NCBI).
GO Annotations
The post-translational modifications (PTMs) and the cellular location of the proteins codified by the genes of the sample selected were determined using QuickGO12, the fast web-based browser provided by the UniProt Knowledgebase (UniProtKB release 2014_08 - Sep 3, 2014).
Statistical tests and gene-clustering
The algorithm for the gene-clustering is found under GEPAS website http://www.gepas.org13. The mathematic package MatLab was used for calculations of statistical tests and of the error handling (© 1984-2010 The MathWorks, Inc).
Results
Compositional features of human-mouse orthologs that in human fit into C2 and C5 composon profiles
It has been previously reported that the human genes from a sample containing 706 human-mouse orthologs could be classified in 11 compositional clusters but that in mouse these orthologs were classified in only 9 clusters. An analysis of the C2 and C5 human-mouse clusters showed that 73 (10%) and 50 (7%) of the human genes, respectively, did not have in mouse the same compositional profile as an indication of nucleotide divergence between them10. Since the ortholog gene sample used for comparison was small relative to the total gene number in this paper we analyzed a 17-fold larger samples of human-mouse orthologs that have in human the C2 and C5 profiles in order to detect the mouse orthologs that relative to the human ones were conserved or diverged during speciation.
Having in mind the criteria described in Materials and Methods we collected a sample of 1996 human-mouse orthologs. In human, all the orthologs had the C2 and C5 profile. Figure 2A illustrates the differences in population between the human and mouse orthologs having the C2 and C5 genes. It was found that 77 genes had in mouse the C2 profile in contrast to 945 in human and that 125 genes had in mouse the C5 profile in contrast to 1051 in human. We may, most likely, conclude that about 83% of the mouse genes of the human-mouse sample of orthologs must notably differ in compositional features relative to their human orthologs since they diverge in composon-usage profiles.
Figure 2B illustrates the C2 and C5 composon-usage profiles of the human genes relative to the base line. It was observed that in mouse only some genes of the sample overlap with the C2 and C5 human profiles (r2=0.998 and 0.996 respectively). In agreement with previously reported data the main difference between the C2 and C5 profiles in both species is referred to the non-overlapping frequency-usages of composons <AG> and <CG> (marked with * in Figure 2B). In fact, in both species, the usage of <CG> is in C2 higher than in C5 while the usage of <AG> is lower in C2 than in C510. Since a high degree of overlapping between the usage-frequencies of the remaining 12 composons was observed (Figure 2B) a certain degree in the pattern of sequence closeness must exist between the genes sharing the C2 and C5 profiles. The high similarity in nucleotide composition (Figure 2C) between the genes from both clusters contrast with the dissimilarity observed in composon-usage between the human-mouse orthologs of the sample. Thus, the composon clustering may provide additional information regarding the organization of nucleotides interspersed in the DNA that could be useful for gene sorting and for the identification of gene features that reveal evolutionary convergence or divergence within the population of human-mouse orthologs.
Figure 2.Similarities and dissimilarities observed in human-mouse orthologs of compositional clusters C2 and C5 in both species. (A) Differences in the gene population of compositional clusters C2 and C5 in human and mouse. (B) Differences observed in the composon-usage of human and mouse C2 (-○-) and C5 (-■-). The baseline (----) represents the expected composon-usage frequency average of long random generated DNA sequences with the same composition for A, T, C and G. The symbol (*) highlights the composons that differ in their usages in C2 and C5 in both human and mouse. (C) The bar graph shows the similarities observed in the mean nucleotide composition observed in C2 (■) and C5 (□) by using equation 5. The base line represents the nucleotide average in randomly generated DNA sequences identical in the number of A, T, C and G (-----).
Chromosomal location of the human genes fitting into the C2 and C5 compositional clusters
It has been reported that often the organization of genes in chromosomes of many eukaryotic genomes makes them to appear as functionally related, evolutionarily conserved or even belong to the same protein–protein interaction network14. In order to know whether or not the genes having high similarity in the C2 and C5 composon-usage profiles are distributed at random or in some way linked to chromosomal clustering we analyzed the chromosomal distribution of the 945 C2 and 1051 C5 genes indicated above. Figure 3 represents the percentage of genes from C2 and C5 distributed in human chromosomes. It was detected that the genes from both clusters have a highly similar chromosomal distribution, r2>0.970, suggesting, therefore, that they must be in some way topologically linked. Table 2 shows that 55% (1098 genes) of the human genes having the C2 and C5 profiles are located in six chromosomes: 1, 2, 11, 16, 17 and 19 while the rest of the genes (898 genes) are distributed in the remaining 18 chromosomes. Chromosomes Y, 13, 18 and 21 contain each the lowest concentration of genes from both clusters (< 0.7% in average). The highest gene density, representing 33% (644 genes) of the total amount of the C2 and C5 genes, is found in chromosomes 1 (8%), 16 (7%) and 19 (18%). Half of these genes display the C2 profile and the other half of the genes display the C5 profile.
Figure 3.Observed chromosomal distribution of the C2 and C5 compositional categories of human genes. The amount of genes in each chromosome is represented as a percentage of the total number of genes fitting into C2 (grey) and C5 (black), respectively.
| Cluster→ | C2 | C5 | C2+C5 | |||
| Chromosome↓ | Nº genes | Genes % | Nº genes | Genes % | Nº genes | Genes % |
| 1* | 69 | 7,3 | 82 | 7,8 | 151 | 7,6 |
| 2* | 43 | 4,6 | 47 | 4,5 | 90 | 4,5 |
| 3 | 26 | 2,8 | 24 | 2,3 | 50 | 2,5 |
| 4 | 30 | 3,2 | 25 | 2,4 | 55 | 2,8 |
| 5 | 35 | 3,7 | 40 | 3,8 | 75 | 3,8 |
| 6 | 34 | 3,6 | 45 | 4,3 | 79 | 4,0 |
| 7 | 35 | 3,7 | 36 | 3,4 | 71 | 3,6 |
| 8 | 29 | 3,1 | 40 | 3,8 | 69 | 3,5 |
| 9* | 44 | 4,7 | 48 | 4,6 | 92 | 4,6 |
| 10 | 37 | 3,9 | 35 | 3,3 | 72 | 3,6 |
| 11* | 56 | 5,9 | 59 | 5,6 | 115 | 5,8 |
| 12 | 29 | 3,1 | 32 | 3,0 | 61 | 3,1 |
| 13 | 10 | 1,1 | 11 | 1,0 | 21 | 1,1 |
| 14 | 29 | 3,1 | 28 | 2,7 | 57 | 2,9 |
| 15 | 27 | 2,9 | 23 | 2,2 | 50 | 2,5 |
| 16* | 65 | 6,9 | 67 | 6,4 | 132 | 6,6 |
| 17* | 53 | 5,6 | 78 | 7,4 | 131 | 6,6 |
| 18 | 8 | 0,8 | 10 | 1,0 | 18 | 0,9 |
| 19* | 170 | 18,0 | 191 | 18,2 | 361 | 18,1 |
| 20 | 47 | 5,0 | 43 | 4,1 | 90 | 4,5 |
| 21 | 10 | 1,1 | 8 | 0,8 | 18 | 0,9 |
| 22 | 35 | 3,7 | 42 | 4,0 | 77 | 3,9 |
| X | 24 | 2,5 | 36 | 3,4 | 60 | 3,0 |
| Y | 0 | 0,0 | 1 | 0,1 | 1 | 0,1 |
| total | 945 | 100 | 1051 | 100 | 1996 | 100 |
In order to analyze whether the C2 and C5 genes are dispersed through the chromosome length, independently clustered in particular chromosomal regions or grouped together in some bands we, then, analyzed the gene distribution in the Giemsa bands of the more populated chromosomes 1, 2, 11, 16, 17 and 19. Figure 4 shows that not only the C2 and C5 genes topologically coexist in chromosomes 11, 16 and 19 but that, in most of the bands, they are present in similar quantities. Figure 4 highlights that the bands having the highest concentration of C2 and C5 genes are in chromosomes 16 and 19. The highest concentration of C2 and C5 genes is found in the telomeric bands 19p13.3 and 16p13.3. The data presented suggest that the gene-clustering revealed by the analysis of the composon-usage might provide information that may be useful to understand how some chromosomal gene-clusters were formed and how it correlates to a particular type of nucleotide organization of nucleotides or structures interspersed along a DNA sequence.
Figure 4.The amount of human genes found per chromosomal band. Number of genes from human clusters C2 (grey) and C5 (black) found in bands of human chromosomes 1, 2, 11, 16, 17 and 19.
Similarities and dissimilarities of all human-mouse orthologs that in band 19p13.3 have the C2 and C5 compositional profiles
It has been shown above that the human chromosomal band 19p13.3 contains a high amount of human genes orthologs to mouse having the C2 and C5 profiles and that there is a notable divergence during speciation. As natural selection might have organized compositionally similar and functionally related genes in chromosomal clusters15, 16, 17, 18, we, accordingly and in order to reinforce the finding described above, compared the compositional features of all the genes of band 19p13.3 and of their mouse orthologs. This data will provide information on how many human C2 and C5 genes of band 19p13.3 diverged from the mouse orthologs being band 19p13,3 considered a mutational hot spot19. As indicated in Materials and Methods genes that had a sequence lower than 100 nucleotide bases and those that do not have GO information in the DNA data banks were excluded from the study.
The analysis indicated that the human genes having the C2 and C5 profiles form a large chromosomal cluster since 132 (75%) genes out of the 175 of genes selected from band 19p13-3 have the C2 and C5 profiles (Figure 5 black bars). Table 3 shows the gene name and compositional profile of each one of the 175 human-mouse orthologs of band 19p13.3. Only 27 mouse orthologs (20%) display the C2 and C5 profiles (Figure 5 gray bars) suggesting that a large majority of the C2 and C5 human-mouse orthologs may have diverged between both species. It was observed that the amount of genes having the C2 and C5 profile is similar since 63 genes have the C2 profile and 69 genes have the C5 profile. It was, moreover, observed that most of the orthologs that in human have the C2 and C5 profiles (132 genes) have in mouse the C6 and C7 profile respectively (see Figure 5 and Table 3), suggesting that most of the divergence observed in the composon-profile between most human-mouse orthologs is due to changes in DNA sequences affecting the usage of the composon that distinguishes the C6 and C7 profiles from C2 and C5. In fact, the application of equation 5 to profiles C2, C5, C6 and C7 shows that the genes having the C2 and C5 profile are GC richer than the genes having the profiles C6 and C7. A differential increase in the frequency use of composons <AG> and <CG> of profiles C6 and C7 could generate the profiles C2 and C510. Thus, we may conclude that 80% of the C2 and C5 human-mouse orthologs from band 19p13.3 (105 genes) have diverged in both species in accordance with the data showing that band 19p13.3 is a mutational hot spot19. In contrast, 27 genes (20%) from band 19p13.3 have the C2 and C5 profiles suggesting that they have been largely conserved during evolution.
Figure 5.Percentage observed per cluster of human-mouse orthologs fitting into band 19p13.3. The bar-graph represents the percentages observed per composon cluster of the human-mouse orthologs fitting into band 19.p13.3 in both human (black) and mouse (grey). The percentages were calculated relative to the total amount of genes in C2 and C5, respectively.
| Gene name | Profile in Hs | Profile in Mm | Gene name | Profile in Hs | Profile in Mm | Gene name | Profile in Hs | Profile in Mm | |||||||
| ADAMTS10 | 2 | 1 | HDGFRP2 | 5 | 2 | ACSBG2 | 1 | 11 | |||||||
| ABHD17A | 2 | 2 | ANKRD24 | 5 | 3 | CHAF1A | 1 | 3 | |||||||
| AMH | 2 | 2 | ARHGEF18 | 5 | 3 | EMR1 | 1 | - | |||||||
| EFNA2 | 2 | 2 | MBD3 | 5 | 3 | CCDC94 | 3 | 3 | |||||||
| FGF22 | 2 | 2 | MUM1 | 5 | 3 | GTF2F1 | 3 | 3 | |||||||
| HCN2 | 2 | 2 | PALM | 5 | 3 | LSM7 | 3 | 3 | |||||||
| KISS1R | 2 | 2 | SH3GL1 | 5 | 3 | RANBP3 | 3 | 3 | |||||||
| MEX3D | 2 | 2 | CACTIN | 5 | 5 | SAFB2 | 3 | 3 | |||||||
| NRTN | 2 | 2 | DAPK3 | 5 | 5 | SMIM24 | 3 | 7 | |||||||
| TPGS1 | 2 | 2 | DIRAS1 | 5 | 5 | TRIP10 | 3 | 1 | |||||||
| ZBTB7A | 2 | 2 | GADD45B | 5 | 5 | ACER1 | 4 | - | |||||||
| ZNRF4 | 2 | 2 | GIPC3 | 5 | 5 | DENND1C | 6 | 7 | |||||||
| TMEM259 | 2 | 4 | HMG20B | 5 | 5 | EBI3 | 6 | 4 | |||||||
| TNFSF9 | 2 | 4 | JSRP1 | 5 | 5 | GPR108 | 6 | 7 | |||||||
| C19orf25 | 2 | 5 | KHSRP | 5 | 5 | IZUMO4 | 6 | 7 | |||||||
| C2CD4C | 2 | 5 | LMNB2 | 5 | 5 | MED16 | 6 | 6 | |||||||
| MAP2K2 | 2 | 5 | MRPL54 | 5 | 5 | ONECUT3 | 6 | 2 | |||||||
| MIDN | 2 | 5 | PIP5K1C | 5 | 5 | REEP6 | 6 | 6 | |||||||
| TRAPPC5 | 2 | 5 | PLEKHJ1 | 5 | 5 | SCAMP4 | 6 | 11 | |||||||
| VMAC | 2 | 5 | REXO1 | 5 | 5 | SLC25A41 | 6 | 7 | |||||||
| ABCA7 | 2 | 6 | SHD | 5 | 5 | SLC39A3 | 6 | 6 | |||||||
| ALKBH7 | 2 | 6 | TCF3 | 5 | 5 | TICAM1 | 6 | 4 | |||||||
| APBA3 | 2 | 6 | TJP3 | 5 | 5 | TNFSF14 | 6 | 7 | |||||||
| APC2 | 2 | 6 | DOT1L | 5 | 6 | TUBB4A | 6 | 7 | |||||||
| ATP5D | 2 | 6 | DUS3L | 5 | 6 | AES | 7 | 7 | |||||||
| CELF5 | 2 | 6 | FZR1 | 5 | 6 | AP3D1 | 7 | 7 | |||||||
| CFD | 2 | 6 | NFIC | 5 | 6 | ATCAY | 7 | 3 | |||||||
| CRB3 | 2 | 6 | PCP2 | 5 | 6 | ATP8B3 | 7 | 1 | |||||||
| DOHH | 2 | 6 | POLR2E | 5 | 6 | CREB3L3 | 7 | 7 | |||||||
| DOS | 2 | 6 | PTPRS | 5 | 6 | FCER2 | 7 | 1 | |||||||
| ELANE | 2 | 6 | SIRT6 | 5 | 6 | FSD1 | 7 | 7 | |||||||
| FEM1A | 2 | 6 | TLE2 | 5 | 6 | GNA11 | 7 | 7 | |||||||
| GAMT | 2 | 6 | ANGPTL4 | 5 | 7 | LDLR | 7 | 7 | |||||||
| GRIN3B | 2 | 6 | ARID3A | 5 | 7 | MOB3A | 7 | 4 | |||||||
| KLF16 | 2 | 6 | BSG | 5 | 7 | TLE6 | 7 | 7 | |||||||
| LPPR3 | 2 | 6 | CDC34 | 5 | 7 | CIRBP | 11 | 11 | |||||||
| MADCAM1 | 2 | 6 | CNN2 | 5 | 7 | PTBP1 | - | 7 | |||||||
| MFSD12 | 2 | 6 | CSNK1G2 | 5 | 7 | EMR4P | - | 9 | |||||||
| NCLN | 2 | 6 | GNA15 | 5 | 7 | ARRDC5 | - | 7 | |||||||
| NDUFA11 | 2 | 6 | HMHA1 | 5 | 7 | C19orf71 | - | 2 | |||||||
| PCSK4 | 2 | 6 | KDM4B | 5 | 7 | R3HDM4 | - | 6 | |||||||
| PLK5 | 2 | 6 | MATK | 5 | 7 | LINGO3 | - | 6 | |||||||
| POLRMT | 2 | 6 | MIER2 | 5 | 7 | ||||||||||
| PRSS57 | 2 | 6 | MISP | 5 | 7 | ||||||||||
| PRTN3 | 2 | 6 | MKNK2 | 5 | 7 | ||||||||||
| PSPN | 2 | 6 | MLLT1 | 5 | 7 | ||||||||||
| RNF126 | 2 | 6 | MPND | 5 | 7 | ||||||||||
| S1PR4 | 2 | 6 | MYDGF | 5 | 7 | ||||||||||
| SBNO2 | 2 | 6 | NFIX | 5 | 7 | ||||||||||
| SEMA6B | 2 | 6 | NMRK2 | 5 | 7 | ||||||||||
| SHC2 | 2 | 6 | OAZ1 | 5 | 7 | ||||||||||
| SPPL2B | 2 | 6 | PIAS4 | 5 | 7 | ||||||||||
| TNFAIP8L1 | 2 | 6 | PLIN3 | 5 | 7 | ||||||||||
| WDR18 | 2 | 6 | PLIN5 | 5 | 7 | ||||||||||
| C19orf24 | 2 | 7 | QTRT1 | 5 | 7 | ||||||||||
| CLPP | 2 | 7 | RPS15 | 5 | 7 | ||||||||||
| GZMM | 2 | 7 | SGTA | 5 | 7 | ||||||||||
| ODF3L2 | 2 | - | SLC25A23 | 5 | 7 | ||||||||||
| ADAT3 | 2 | - | STAP2 | 5 | 7 | ||||||||||
| BTBD2 | 2 | - | STK11 | 5 | 7 | ||||||||||
| PRR22 | 2 | - | ZFR2 | 5 | 7 | ||||||||||
| CD320 | 2 | QIL1 | 5 | 10 | |||||||||||
| PNPLA6 | 2 | GPX4 | 5 | 11 | |||||||||||
| LONP1 | 5 | 11 | |||||||||||||
| UHRF1 | 5 | 11 | |||||||||||||
| DAZAP1 | 5 | - | |||||||||||||
| MYO1F | 5 | ||||||||||||||
| PNPLA6 | 5 | ||||||||||||||
| TIMM44 | 5 | ||||||||||||||
GO correlations between human genes having the C2 and C5 profiles in the band 19p13.3
In order to examine whether the clustering based in the similarity and the dissimilarity of composon usage profiles may provide a layer of biological information linked to GO an analysis of the human-mouse orthologs of band 19p13.3 was carried out correlated with GO. To do that, we considered the cellular location and the PTMs as the most relevant GO categories. All data were normalized in percentages relative to the total number of genes fitting into C2 and C5 in band 19p13.3 with a GO category well defined in the UniProtKB. The analysis indicated that out of the 132 human-mouse orthologs located in band 19p13.3 fitting into C2 and C5 only 89 genes have GO annotations regarding the PTMs and 118 genes have GO regarding the cellular location. The analysis of these proteins revealed (Figure 6) a bias toward dissimilar cellular locations and PTMs. We observed (Figure 6A) that 72% of the proteins codified by genes from cluster C2 are biased toward the membrane and/or the extracellular matrix in contrast to 28% in C5. In C5, however, 74% of the proteins are biased toward the nucleus and/or the cytoplasm in contrast to 26% in C2. Regarding the PTMs we observed (Figure 6B) that 87% of the proteins codified by genes from cluster C2 are biased toward specific PTMs as glycosylation and disulfide bridges in contrast to 13% in C5. In C5, however, the PTMs are biased toward phosphorylated and/or acetylated-proteins (71%) in contrast to 29% from C2.
A relationship between the PTM type and the cellular location was observed. Figure 6 shows that not only C2 genes codify mainly for membrane and secreted-proteins but that the proteins are also glycosylated having mainly disulfide bridges. On the other hand, the C5 genes codifying mainly for nuclear and/or cytoplasmic proteins are mostly phosphorylated and/or acetylated. The data presented are in agreement with published data indicating that in general secreted and membrane proteins, mainly those having extracellular segments, are glycosylated usually having disulfide bonds20, 21, 22 while the highest concentration of phosphorylated, acetylated-proteins or both is found localized in the cell nucleus and in the cytoplasm23, 24.
Figure 6.GO-annotation of genes fitting into human composon clusters C2 and C5 located in the chromosomal band 19p13.3. Differences observed in cellular locations (A) and PTMs patterns (B) in genes fitting into C2 (white) and C5 (grey). The percentages were calculated relative to the total amount of genes in C2 and C5.
Discussion
The simplicity of the method described and its reduced dimensionality provide some benefits when DNA sequences between genes, mainly orthologs, are analyzed and clustered in a nucleotide context-dependent manner. The method is useful to group thousands of genes showing similarities and dissimilarities regarding their composon-usage frequency10. Classically, gene-clusters were obtained on the basis of expression data and a biological knowledge was a posteriori used to make the most of the clusters25, 26, 27. In other cases, certain unsupervised gene-clustering algorithms based on the integration of external biological knowledge, such as GO annotations into expression data, were proposed7. In this paper, the gene-clusters were obtained a priori on the basis of the similarities and differences observed by analysis of the profile of the composon usage-frequency of DNA sequences10 without previous knowledge of gene function and expression. The GO annotations were used a posteriori to check whether or not the composon categories convey and correlate with some type of biological information (functional clustering) that could potentially correlate with the observed chromosomal clustering.
The data shown indicate that notable differences were observed in the number of genes present in clusters C2 and C5, in human relative to mouse (Figure 2A-B) suggesting the existence of evolutionary sequence divergence between the human and mouse orthologs during speciation. It was also observed that there are notable differences in the usage of composons <AG> and <CG> between C2 and C5 (Figure 2B) as it was previously shown in studies in which the similarities and dissimilarities of a small gene sample was analyzed10. The difference in composon-usage of <AG> vs <CG> is not reflected, however, in the average G+C content of the genes fitting into C2 and C5 as calculated by equation 5 (G+C content,65±6% for C2 and 61±7% for C5). Thus, while the analysis of the G+C content does not allow locating the genes from C2 and C5 in different categories the composon-usage frequency can differentially cluster them Figure 2B. This suggests that even though both clusters must be evolutionarily related, since they share the usage of 12 composons, they differ in terms of a compositional-structure interspersed in the DNA sequence.
The data presented shows that the genes fitting into C2 and C5 are not distributed at random in the chromosomal complement since 55% of the C2 and C5 genes are located in specific bands of six chromosomes and in specific GC-rich isochores. It is most likely that the genes located in these isochores would be tightly linked to biological properties, as reported19, 28. We think that the distribution of genes over different chromosomes and also in specific chromosomal regions (chromosomal clustering) instead of appearing arbitrarily distributed might have an effect on their average accessibility to competent regulatory factors and be rationalized on the basis of different regional chromosomal neighbor base dependent mutations. Nature might have exploited this as a factor influencing the chromosomal distribution of genes that require frequent adaptive changes as opposed to those that do not. If this is so, the composon-usage specific pattern of C2 and C5 might be considered an adaptive character correlating with genes “requiring” frequent functional adjustments. The presence of composon clusters such as C2 and C5 would entail that it confers some type of selective advantage as an indication that evolutionary mechanisms might exist to promote the formation and maintenance of composon clusters as it has been suggested for functional clusters and that they are not constrained by gene expression or other properties3.
The comparison of the gene population of the composon-usage profiles of C2 and C5 genes from mouse and human indicated that 80% of human-mouse orthologs from C2 and C5 are dissimilar as an indication that they have diverged during evolution. This suggestion is supported by previously reported data indicating that genes located in GC-rich chromosomal regions in the human genome are maintained by strong selective pressure29 and that mutational pressures and natural selection were both intimately interconnected with the evolution of such structures in the mammalian genome30, 31.
The analysis of a telomeric region of chromosome 19 (band 19p13.3) showed that this region is rich in genes that belong to composon clusters C2 and C5. In fact, 75% of the genes located in band 19p13.3 belong to the C2 and C5 genes GC- rich in agreement with previous observations indicating that human telomeric regions are GC-rich31. The C2 and C5 gene density existing in band 19p13.3 and their sequence divergence could be explained by gene duplication followed by mutation.
It is worth noting that genes that are located in band 19p13.3 collocate in mouse in a syntenic region of chromosome 1032, 33. The similarity in GC content between C2 and C5 (Figure 2A and Figure 2C) may also explain why a large proportion of genes fitting into these compositional categories collocate in regions that have been described to be rich in GC content. We think that the divergence observed between the C2 and C5 genes located in the telomeric region of the human chromosome 19, relative to mouse, is in agreement with data showing that the genes located in that telomeric region change notably faster than the genes located in any other chromosome29, 34.
It should be noticed, moreover, that despite the fact that most of their human C2 and C5 genes diverge in composon-usage relative to their orthologs in mouse a significant proportion of them (about 20%) does not exhibit that behavior since they have a similar composon-usage in both species. The presence of divergent and conserved genes that belong to a given cluster in a particular chromosomal region of high variability suggests that not all genes that are topologically clustered change during evolution. Why the conserved genes fitting into C2 and C5 in spite of being included in a hot spot chromosomal region subjected to a high number of neighbor base dependent mutations do not show accelerated evolution is an intriguing question. These genes could be considered older if it is assumed that the age of a gene is defined by considering the taxonomic distribution of the genes in the family, that is, by the presence or absence of the gene in diverse lineages. As reported, old genes evolve more slowly and experience stronger purifying selection than young genes34, 35, 36, 37, 38, 39. Thus, it is most likely that no relatively recent or only moderately old homology groups could be found. In a certain sense, there are no new genes or there hardly are any new genes, only new genes duplicates or modifications of pre-existing genes and combinations of parts of pre-existing genes.
Since the data presented indicate that most of the C2 and C5 genes that collocate in the human band 19p13.3 have a bias toward different PTMs and cellular locations (Figure 6), depending on the category (C2 or C5) at with they pertain, we may suggest that in addition to showing similarities and dissimilarities between genes in compositional features the composon clustering may convey some layer of biological information. The results obtained are supported by data indicating that in general secreted and membrane proteins, mainly those having extracellular segments, are glycosylated having usually disulfide bonds20, 21, 22 while the highest concentration of phosphorylated and acetylated-proteins, or both, is localized mainly in the cell nucleus and the cytoplasm23, 24. Also, in general, genes that reside preferentially in mutational hot regions are biased toward extracellular communication as surface receptors, cell adhesion and immune response while those in cold spot mutational regions are biased toward essential cellular processes such as gene regulation, RNA processing and nucleic acid metabolism40. In spite of being band 19p13.3 a mutational hot spot region29, 41, in the particular case of C2 and C5 genes, divergent and conserved genes topologically coexist.
Acknowledgments
Prof. Emile Zuckerkandl died in November 9, 2013. We are indebted to him because without his direction, support and scientific vision this and other previous work would have never been carried out. In Memoriam.
This work was supported by a program of the Instituto de Salud Carlos III-Redes Temáticas de Investigación Cooperativa en Salud (ISCIII-RETIC RD06/0021/0008 program). An institutional grant from Fundación Ramón Areces is also acknowledged. The funders had no role in study, design, data collection and analysis, decision to publish, or preparation of the manuscript.
List of abbreviations
PTM: Post Translational Modification; CDS: coding sequence; GO: Gene Ontology; Hs: Homo sapiens; Mm: Mus musculus
References
- 1.J M Lee, Sonnhammer E L. (2003) Genomic gene clustering analysis of pathways in eukaryotes. , Genome Res 13, 875-882.
- 2.L D Hurst, Pal C, Lercher M J. (2004) The evolutionary dynamics of eukaryotic gene order. , Nat Rev Genet 5, 299-310.
- 3.Yi G, Sze S H, Thon M R. (2007) Identifying clusters of functionally related genes in genomes. , Bioinformatics 23, 1053-1060.
- 4.Teichmann S A, Veitia R A. (2004) Genes encoding subunits of stable complexes are clustered on the yeast chromosomes: an interpretation from a dosage balance perspective. , Genetics 167, 2121-2125.
- 5.Yeung M K, Tegner J, Collins J J. (2002) Reverse engineering gene networks using singular value decomposition and robust regression. , Proc Natl Acad Sci U S A 99, 6163-6168.
- 6.Bryan J. (2004) Problems in gene clustering based on gene expression data. , J Multivariate Anal 90, 44-66.
- 7.Verbanck M, S Le, Pages J. (2013) A new unsupervised gene clustering algorithm based on the integration of biological knowledge into expression data. , BMC Bioinformatics 14, 42.
- 8.Godfrey P A, Malnic B, Buck L B. (2004) The mouse olfactory receptor gene family. , Proc Natl Acad Sci U S A 101, 2156-2161.
- 9.Malnic B, Godfrey P A, Buck L B. (2004) The human olfactory receptor gene family. , Proc Natl Acad Sci U S A 101, 2584-2589.
- 10.Fuertes M A, Perez J M, Zuckerkandl E, Alonso C. (2010) Introns form compositional clusters in parallel with the compositional clusters of the coding sequences to which they pertain. , J Mol Evol 72, 1-13.
- 11.MacQueen B. (1967) ed. Proceedings of 5th Berkeley symposium on mathematical statistics and probability) (University of California Press , Berkeley) 1, 281-297.
- 12.Ashburner M. (2000) Gene ontology: tool for the unification of biology. The Gene Ontology Consortium. , Nat Genet 25, 25-29.
- 13.Montaner D. (2006) Next station in microarray data analysis:. , GEPAS. Nucleic Acids Res 34, 486-491.
- 14.Pignatelli M, Serras F, Moya A, Guigo R, Corominas M. (2009) CROC: finding chromosomal clusters in eukaryotic genomes. , Bioinformatics 25, 1552-1553.
- 15.Cohen B A, Mitra R D, Hughes J D, Church G M. (2000) A computational analysis of whole-genome expression data reveals chromosomal domains of gene expression. , Nat Genet 26, 183-186.
- 16.Lercher M J, Blumenthal T, Hurst L D. (2003) Coexpression of neighboring genes in Caenorhabditis elegans is mostly due to operons and duplicate genes. , Genome Res 13, 238-243.
- 17.Boutanaev A M, Kalmykova A I, Shevelyov Y Y, Nurminsky D I. (2002) Large clusters of co-expressed genes in the Drosophila genome. , Nature 420, 666-669.
- 18.Spellman P T, Rubin G M. (2002) Evidence for large domains of similarly expressed genes in the Drosophila genome. , J Biol 1, 5.
- 19.Costantini M, Clay O, Auletta F, Bernardi G. (2006) An isochore map of human chromosomes. , Genome Res 16, 536-541.
- 20.Juneja S C, Veillette C. (2013) Defects in tendon, ligament, and enthesis in response to genetic alterations in key proteoglycans and glycoproteins: a review. Arthritis. 154812.
- 21.Ruddock L W, Molinari M. (2006) N-glycan processing in ER quality control. , J Cell Sci 119, 4373-4380.
- 22.Sevier C S, Kaiser C A. (2002) Formation and transfer of disulphide bonds in living cells. , Nat Rev Mol Cell Biol 3, 836-847.
- 23.Choudhary C, Weinert B T, Nishida Y, Verdin E, Mann M. (2014) The growing landscape of lysine acetylation links metabolism and cell signalling. , Nat Rev Mol Cell Biol 15, 536-550.
- 25.Bauer S, Gagneur J, Robinson P N. (2010) GOing Bayesian: model-based gene set analysis of genome-scale data. , Nucleic Acids Res 38, 3523-3532.
- 26.Busold C H. (2005) Integration of GO annotations in Correspondence Analysis: facilitating the interpretation of microarray data. , Bioinformatics 21, 2424-2429.
- 27.Fagan A, Culhane A C, Higgins D G. (2007) A multivariate analysis approach to the integration of proteomic and gene expression data. , Proteomics 7, 2162-2171.
- 29.Castresana J. (2002) Genes on human chromosome 19 show extreme divergence from the mouse orthologs and a high GC content. , Nucleic Acids Res 30, 1751-1756.
- 30.Fryxell K J, Zuckerkandl E. (2000) Cytosine deamination plays a primary role in the evolution of mammalian isochores. , Mol Biol Evol 17, 1371-1383.
- 31.Flint J. (1997) The relationship between chromosome structure and function at a human telomeric region. , Nat Genet 15, 252-257.
- 32.Burmeister M, Bryda E C, Bureau J F, Noben-Trauth K. (1998) . Encyclopedia of the mouse genome VII. Mouse chromosome 10. Mamm Genome 8 Spec No 200-214.
- 33.Mohrenweiser H. (1996) Report an abstracts of the third international workshop on human chromosome 19 mapping1996. , Cytogenet Cell Genet 74, 161-186.
- 34.Waterston R H. (2002) Initial sequencing and comparative analysis of the mouse genome. , Nature 420, 520-562.
- 35.Wolf Y I, Novichkov P S, Karev G P, Koonin E V, Lipman D J. (2009) The universal distribution of evolutionary rates of genes and distinct characteristics of eukaryotic genes of different apparent ages. , Proc Natl Acad Sci U S A 106, 7273-7280.
- 36.Garcia-Vallve S, Alonso A, Bravo I G. (2005) Papillomaviruses: different genes have different histories. , Trends Microbiol 13, 514-521.
- 37.Alba M M, Castresana J. (2007) On homology searches by protein Blast and the characterization of the age of genes. , BMC Evol Biol 7, 53.
- 38.Alba M M, Castresana J. (2005) Inverse relationship between evolutionary rate and age of mammalian genes. , Mol Biol Evol 22, 598-606.
- 39.Daubin V, Ochman H. (2004) Start-up entities in the origin of new genes. , Curr Opin Genet Dev 14, 616-619.
Cited by (4)
- 1.Fuertes Miguel A., Rodrigo José R., Alonso Carlos, 2019, Conserved Critical Evolutionary Gene Structures in Orthologs, Journal of Molecular Evolution, 87(2-3), 93, 10.1007/s00239-019-09889-1
- 2.Fuertes Miguel Angel, Rodrigo José Ramón, Alonso Carlos, 2016, Do Intron and Coding Sequences of Some Human–Mouse Orthologs Evolve as a Single Unit?, Journal of Molecular Evolution, 82(6), 247, 10.1007/s00239-016-9746-8
- 3.Fuertes Miguel Angel, Rodrigo José Ramón, Alonso Carlos, 2017, A Method for the Annotation of Functional Similarities of Coding DNA Sequences: the Case of a Populated Cluster of Transmembrane Proteins, Journal of Molecular Evolution, 84(1), 29, 10.1007/s00239-016-9763-7
- 4.Fuertes Miguel Angel, López-Arguello Silvia, Alonso Carlos, 2019, Evolutionary conserved compositional structures hidden in genomes of the foot-and-mouth disease virus and of the human rhinovirus, Scientific Reports, 9(1), 10.1038/s41598-019-53013-8