
Prevalence of Non-Fistulous Urinary Incontinence among Nonparturient Women in A Tertiary Hospital
Abstract
Objective:
To determine the prevalence and risk factors of non-fistulous urinary incontinence (UI) among non-parturient women at University College Hospital, Ibadan, Nigeria.
Methods:
A hospital based cross sectional study of 500 non-parturient women presenting with non- fistulous gynaecological symptoms at the University College Hospital, Ibadan. An interviewer administered questionnaire was used to obtain information. Data were analyzed using SPSS version 20. Data analysis involved descriptive statistics, bivariate and multivariate analysis to determine the risk factors of urinary incontinence.
Results:
Mean age was 36.61 (SD=10.1) years and almost all (83.2%) were married. Prevalence of urinary incontinence is 21.4%. Majority (40.6%) had symptoms of stress urinary incontinence and 8.0% had urge urinary incontinence. Only 19.6% of those who leaked urine in the last one month sought medical attention despite visiting the hospital for other ailment(s), while of those that had ever leaked urine, 13.1% of them ever sought medical attention. Risk factors for UI were age at first delivery (OR=21.21, 95%CI=2.179-206.478), marital status (OR=0.142, 95%CI=0.044-0.454), chronic illness (OR=3.987, 95%CI=2.147-7.405) and history of prolonged labour (OR=3.111, 95%CI=1.584-6.110).
Conclusion:
UI is not uncommon in Nigeria. The identified predisposing factors were low age at first delivery, history of prolonged labour and chronic illness. There is need to sensitize women of the symptoms and complications associated with urinary incontinence as well as its prevention and need to seek medical care if they have the symptoms.
Author Contributions
Academic Editor: Manjubala Dash Professor, Mother Theresa Post Graduate & Research Institute of Health Sciences, India.
Checked for plagiarism: Yes
Review by: Single-blind
Copyright © 2018 Oluwasomidoyin Olukemi Bello.
 This is an open-access article distributed under the terms of the Creative Commons Attribution License, which permits unrestricted use, distribution, and reproduction in any medium, provided the original author and source are credited.
Competing interests
The authors have declared that no competing interests exist.
Citation:
Introduction
Urinary incontinence (UI) definition changed from ‘the involuntary loss of urine that is a social or hygienic problem and is objectively demonstrable’ in 1979 to ‘the complaint of any involuntary leakage of urine’ in 2002. 1, 2The International Continence Society (ICS) defined urinary incontinence as “any form of urine leakage” so as to include the entire population of individuals who have either complained or are currently having urine leakage. 2, 3, 4
Urinary incontinence varies in degree of severity from several drops to complete bladder emptying and may occur daily, many times a day, or only occasionally perhaps once a month. It may be fairly predictable (low-grade stress incontinence) or totally unpredictable (urge incontinence). 5 Urinary incontinence affects women of all ages and is due to the bladder dysfunction, failure of urethral sphincter control or weakness of pelvic floor muscles. 6The prevalence of UI increases with age, with one-third of women older than age 65 years experiencing some degree of UI. 7 There are different types of UI - stress, urge, mixed, overflow, continuous type (total) and others. 8 A history of urine leakage (generally small amounts) during periods of increased abdominal pressure (laughing, sneezing, coughing, lifting, high-impact physical activity) suggests a diagnosis of stress UI, while urge UI is an urge to urinate but being unable to reach the toilet before leaking or having a strong sudden urge to go to the toilet to urinate with no advance warning and mixed UI symptoms has at least one stress and one urge symptom. 2, 9 Numerous factors have been associated with UI including age, pregnancy, childbirth, obesity, depression, diabetes, hypertension, fibroids, hysterectomy, vaginal surgery, chronic cough, high intake of caffeine, drugs. 10, 11, 12
Urinary incontinence is a source of health-related poor quality of life, self esteem and regarded as a disgraceful situation. It is, however, not often disclosed, except when specifically enquired about by the healthcare provider or when it causes social embarrassment. 13, 14 UI could lead to physical, social, psychological, sexual and economic problems among women of all age groups. 15 It is also a costly health concern with its excessive burden more among the older female adults and the health-care system. 9, 16
Many women with urinary incontinence do not seek care for their condition. This is because UI could be of a mild and so they do not feel that treatment of the condition is warranted, others are embarrassed to speak with a health care provider about their condition or fear that treatment will require surgery. 17, 18 It is thus against this background that this study is aimed at determining the prevalence of urinary incontinence among non-parturients women presenting with non-fistulous gynaecological complaint(s) at the gynaecology clinic in University College Hospital, Ibadan, Nigeria.
Methods
A hospital based cross sectional study carried out from October 2016 to March, 2017 at the University College Hospital, Ibadan, a government tertiary health facility. Five hundred consenting non-parturients were recruited during the study period. Data was collected by four trained research assistants using validated questionnaire (Incontinence Questionnaire-Urinary Incontinence-Short Form) which was structured and modified to include five sections: socio-demographics characteristics, obstetrics and gynaecology history, medical history, history and symptoms of UI and impact of UI on their daily activities.
In this study urinary incontinence was defined as involuntary leakage of urine of any form. Stress UI symptoms was defined as a leak or loss of urine caused by sneezing, coughing, exercising, lifting or physical activity, urge UI symptoms was defined as an urge to urinate but being unable to reach the toilet before leaking or having a strong sudden urge to go to the toilet to urinate with no advance warning and mixed UI symptoms was defined as at least one stress and one urge symptom. 2 Data collected was cleaned, entered and analyzed using the IBM SPSS Statistics 20. Bivariate and multivariate analysis was carried out. Logistic regression was used to determine the risk factors of UI among the women. The level of statistical significance was set at p <0.05 and 95% confidence level. Pregnant women, breastfeeding mothers, women less than 16 years and those who presented with urinary fistula were excluded from the study.
Ethical approval was obtained from the Oyo state ethical review committee and a written informed consent was obtained from each of the participant before administering the questionnaire.
Results
The prevalence of urinary incontinence was 21.4% among the 500 women who participated in the study. Their mean age was 36.61 (SD=10.1) years and a higher proportion 36.8% fall within the 26-35 age category. More than half (67.6%) had tertiary level of education with almost all (83.2%) being married (Table 1).
Table 1. Participants Demographics.| VARIABLES | FREQUENCY(n=500) | PERCENT |
| AGE | ||
| 16-25 | 65 | 13 |
| 26-35 | 184 | 36.8 |
| 36-45 | 159 | 31.8 |
| 46 and above | 62 | 18.4 |
| Mean age 36.61(SD=10.1) years | ||
| LEVEL OF EDUCATION | ||
| Primary | 32 | 6.4 |
| Secondary | 130 | 26 |
| Tertiary | 338 | 67.6 |
| MARITAL STATUS | ||
| Single | 58 | 11.6 |
| Married | 416 | 83.2 |
| Divorced | 3 | 0.6 |
| Separated | 10 | 2 |
| Widowed | 13 | 2.6 |
The mean age at first and last delivery was 20.89 (SD=12.09) and 29.32 (SD =16.52) years respectively. A little above a quarter (28.6%) of the participants has had two parous experience and 22.8% were nulliparous women. Less than a quarter (22.5%) and 8.5% of the study population had history of prolonged labour and prolonged second stage respectively. Very few of them (13.7%) ever had babies weighing more than 4kg. Only 92 (18.4%) of the study population have a chronic illness with diabetes (52.2%) being the commonest illness type, followed by hypertension (15.2%) (Table 2).
Table 2. Medical and Obstetric History.| Variable | Frequency | Percent | |
| Parity | |||
| 0 | 114 | 22.8 | |
| 1 | 118 | 23.6 | |
| 2 | 143 | 28.6 | |
| 3 | 83 | 16.6 | |
| 4 | 34 | 6.8 | |
| 5 | 4 | 0.8 | |
| 6 | 4 | 0.8 | |
| AGE AT FIRST DELIVERY (years)* | |||
| <20 | 22 | 5.7 | |
| 20-24 | 87 | 22.5 | |
| 25-29 | 156 | 40.4 | |
| 30-34 | 96 | 24.9 | |
| ≥35 | 25 | 6.5 | |
| Mean 20.89 (SD=12.09) | |||
| AGE AT LAST DELIVERY (years)** | |||
| <25 | 8 | 2.7 | |
| 25-34 | 182 | 61.7 | |
| ≥35 | 105 | 35.6 | |
| Mean 29.32 (SD =16.52) | |||
| Mode of delivery of first pregnancy* | |||
| SVD | 253 | 65.5 | |
| CS | 104 | 26.9 | |
| AVD | 29 | 7.5 | |
| Mode of delivery of second pregnancy (n=268) | |||
| SVD | |||
| CS | 175 | 65.3 | |
| AVD | 79 | 29.5 | |
| 14 | 5.2 | ||
| Mode of delivery of third pregnancy (n=121) | |||
| SVD | |||
| CS | 91 | 75.2 | |
| AVD | 23 | 19 | |
| 7 | 5.8 | ||
| Mode of delivery of fourth pregnancy (n=37) | |||
| SVD | |||
| CS | 23 | 62.2 | |
| AVD | 10 | 27 | |
| 4 | 10.8 | ||
| Had history of prolonged labour?* | |||
| Yes | 87 | 22.5 | |
| No | 299 | 77.5 | |
| Prolonged second stage* | |||
| Yes | 33 | 8.5 | |
| No | 353 | 91.5 | |
| Ever had a ≥ 4kg baby?* | |||
| Yes | 53 | 13.7 | |
| No | 353 | 86.3 | |
| ANY CHRONIC ILLNESS? | |||
| Yes | 92 | 18.4 | |
| No | 408 | 81.6 | |
| ILLNESS TYPE | |||
| Diabetes | 48 | 52.2 | |
| Thyroid disorder | 1 | 1.1 | |
| Neurological illness | 1 | 1.1 | |
| Hypertension | 14 | 15.2 | |
| Depression | 6 | 6.5 | |
| Peptic Ulcer Disease | 5 | 5.4 | |
| HIV infection | 9 | 9.8 | |
| Fibroid | 7 | 7.6 | |
| Hepatitis B | 1 | 1.1 | |
Of the 21.4% of the participants who had ever leaked urine, less than one-fifth (18.8%) leaked urine involuntarily in the last 12 months with/without activities while 9.2% leaked urine in the last one month. Majority (43.5%) leaked about 8 times a week with most of them (30.4%) regularly changing their underwear, 26.1% of them do nothing while others use pant liner and increase their frequency of urination to manage the situation. Only 19.6% of the 46 women that leaked in the last one month sought medical attention, while of the overall population that ever leaked; only 13.1% ever sought medical attention (Table 3).
Table 3. Symptoms and Management of Ui among the Study Population.| Variable | Frequency | Percent |
|---|---|---|
| Ever involuntarily leaked urine?YesNo | 107393 | 21.478.6 |
| Ever leaked urine involuntarily in the last 12 months with/without activities?YesNo | 94406 | 18.881.2 |
| Have you involuntarily leaked urine in the last one month?YesNo | 46454 | 9.290.8 |
| How often do you leak urine involuntarily?EverydayFew (1-3) days in a weekAbout 8 times a weekAbout 12 times a week | 612208 | 13.026.143.517.4 |
| Managing the situationUse of pant linerRegular change of underwearIncrease in frequency of urinationNothing | 10141012 | 21.730.421.726.1 |
| Ever sought medical attention in the last one month?YesNo | 937 | 19.680.4 |
| Ever sought medical attention at all?YesNo | 1493 | 13.186.9 |
Among those who leaked in the last one month, majority experience leakage when they laugh, cough suddenly and sneeze 10.2%, 8.6% and 8.0% respectively (Figure 1).
Figure 1.Symptoms of UI among participants that leaked in the last one month.
A few (11.2%) of the participants are aware of anyone with UI, about one-quarter had heard of SUI, 20.6% has heard of UUI while 15.8% has heard of mixed incontinence (Figure 2).
Figure 2.Participants’ general knowledge of UI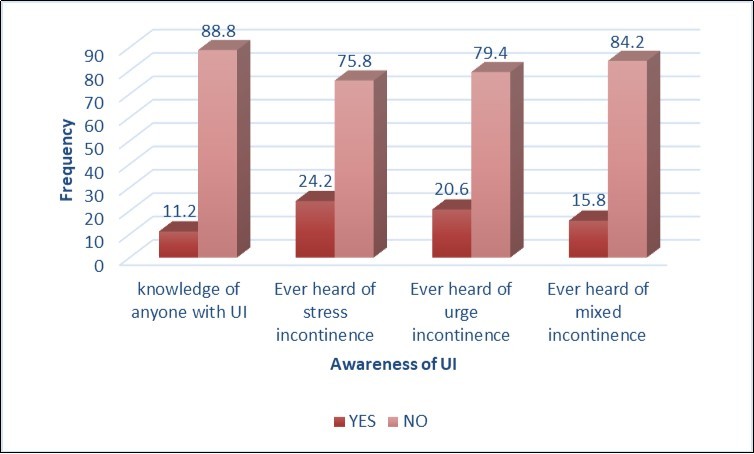
In this study, the identified factors predisposing participants to UI are age (p=0.021), parity (p=<0.001), marital status (p=<0.001), having a chronic illness (p=<0.001), age at first delivery (p=0.031), history of prolonged labour (p=<0.001), history of prolonged second stage (p=<0.001), delivery of > 4kg weight baby (p=0.048) and menopause (p=0.022) (Table 4).
Table 4. Bivariate Analysis of Factors Predisposing Participants to Ui| V ariables | Ever leaked urine before? | Total | Chi square | P-value | ||
| Yes | No | |||||
| Age | 9.69 | 0.021 | ||||
| 16-25 | 6 (5.6) | 59 (15.0) | 65(13.0) | |||
| 26-35 | 37 (34.6) | 147(37.4) | 184(36.8) | |||
| 36-45 | 37 (34.6) | 122(31.0) | 159(31.8) | |||
| ≥45 | 27 (25.2) | 65 (16.5) | 92 (18.4) | |||
| Educational status | 13.94 | 0.001 | ||||
| Primary | 15 (14.0) | 17 (4.3) | 32 (6.4) | |||
| Secondary | 29 (27.1) | 101(25.7) | 130(26.0) | |||
| Tertiary | 63 (58.9) | 275(70.0) | 338(67.6) | |||
| Occupation | 0.41 | 0.814 | ||||
| Skilled | 46 (43.0) | 170(43.3) | 216(43.2) | |||
| Semi-skilled | 31 (29.0) | 123(31.3) | 154(30.8) | |||
| Unskilled | 30 (28.0) | 100(25.4) | 130(26.0) | |||
| Marital status | 17.83 | <0.001 | ||||
| Single | 9 (8.4) | 49 (12.5) | 58 (11.6) | |||
| Married | 84 (78.5) | 332(84.5) | 416(83.2) | |||
| others | 14 (13.1) | 12 (3.1) | 26 (5.2) | |||
| Do you have any chronic illness? | 46.809 | <0.001 | ||||
| Yes | 44 (41.1) | 48 (12.2) | 92 (18.4) | |||
| No | 63 (58.9) | 345(87.8) | 408(81.6) | |||
| Age at first delivery | 10.67 | 0.031* | ||||
| <20 | 4 (4.5) | 18 (6.1) | 22 (5.7) | |||
| 20-24 | 27 (30.3) | 60(20.2) | 87(22.5) | |||
| 25-29 | 40 (44.9) | 116(39.1) | 156(40.4) | |||
| 30-34 | 17 (19.1) | 79 (26.6) | 96 (24.9) | |||
| ≥35 | 1 (1.1) | 24 (8.1) | 25 (6.5) | |||
| Age at last delivery | 2.67 | 0.264 | ||||
| <25 | 4 (5.3) | 4 (1.8) | 8 (2.7) | |||
| 25-34 | 47 (61.8) | 135(61.6) | 182(61.7) | |||
| ≥35 | 25 (32.9) | 80 (36.5) | 105(35.6) | |||
| Parity | 17.97 | <0.001 | ||||
| 0 | 16 (15.0) | 98 (24.9) | 114(22.8) | |||
| 1 | 19 (17.8) | 99 (25.2) | 118(23.6) | |||
| 2-3 | 54 (50.5) | 172(43.8) | 226(45.2) | |||
| ≥ 4 | 18(16.8) | 24(6.1) | 42(8.4) | |||
| Mode of delivery (1) | 2.38 | 0.304 | ||||
| SVD | 55 (61.8) | 198(66.7) | 253(65.5) | |||
| CS | 24 (27.0) | 80 (26.9) | 104(26.9) | |||
| AVD | 10 (11.2) | 19 (6.4) | 19 (7.5) | |||
| Mode of delivery (2) | 5.13 | 0.077 | ||||
| SVD | 40 (58.8) | 135(67.5) | 175(65.3) | |||
| CS | 21 (30.9) | 58 (20.9) | 79 (29.5) | |||
| AVD | 7 (10.3) | 7 (3.5) | 14 (5.2) | |||
| Mode of delivery (3) | 3.1 | 0.212 | ||||
| SVD | 24 (70.6) | 67 (77.0) | 91 (75.2) | |||
| CS | 6 (17.6) | 17 (19.5) | 23 (19.0) | |||
| AVD | 4 (11.8) | 3 (3.4) | 7 (5.8) | |||
| Mode of delivery (4) | 3.72 | 0.156 | ||||
| SVD | 9 (64.3) | 14 (60.9) | 23 (62.3) | |||
| CS | 2 (14.3) | 8 (34.8) | 10 (27.0) | |||
| AVD | 3 (21.4) | 1 (4.3) | 4 (10.8) | |||
| History of prolonged labour | 31.28 | <0.001 | ||||
| Yes | 40 (44.0) | 47 (15.9) | 87 (22.5) | |||
| No | 51 (56.0) | 248(84.1) | 299(77.5) | |||
| History of prolonged second phase | 23.69 | <0.001 | ||||
| Yes | 19 (21.1) | 14 (4.7) | 33 (8.5) | |||
| No | 71 (78.9) | 282(95.3) | 353(91.5) | |||
| Baby weight >4kg | 3.89 | 0.048 | ||||
| Yes | 18 (20.0) | 35 (11.8) | 53 (13.7) | |||
| No | 72 (80.0) | 261(88.2) | 333(86.3) | |||
| Menopause | 5.23 | 0.022 | ||||
| Yes | 22 (20.6) | 47 (12.0) | 69 (13.8) | |||
| No | 85 (79.4) | 346(88.0) | 431(86.2) | |||
Women who had their first delivery within 20-24 years of age were about 21 times likely than those of them whose age at first delivery is ≥35 years to develop UI (OR=21.21, 95%CI=2.179-206.478), women whose age at first delivery is within 25-29 years age category were 13 times more likely to have UI than those ≥35 years of age (OR=13.16, 95%CI=1.444-119.999) while those of them whose age at first delivery is from 30-34 years were 11 times likely than those ≥35 years of age to develop UI (OR=11.41, 95%CI=1.203-108.155). Also, nulliparous women were 7 times more likely to develop UI. Participants who reported having chronic illness had about 4 times chances to develop UI compared to those without chronic illness (OR=3.987, 95%CI=2.147-7.405). The women who had history of prolonged labour were 3 times likely than those with no history of prolonged labour to develop UI (OR=3.111, 95%CI=1.584-6.110) (Table 5).
Table 5. Logistic Regression Analysis of The Determinants of Ui Among the Participants.| Factors | Odds Ratio | 95% CI | P-Value |
|---|---|---|---|
| Age | |||
| 16-25 | 0.369 | 0.030-4.517 | 0.436 |
| 26-35 | 1.734 | 0.574-5.239 | 0.329 |
| 36-45 | 1.988 | 0.665-5.942 | 0.219 |
| ≥45 (Ref) | - | - | - |
| Age at first delivery | |||
| <20 | 11.89 | 0.764-185.074 | 0.077 |
| 20-24 | 21.21 | 2.179-206.478 | 0.009 |
| 25-29 | 13.16 | 1.444-119.999 | 0.022 |
| 30-34 | 11.41 | 1.203-108.155 | 0.034 |
| ≥35 (Ref) | - | - | - |
| Parity | |||
| 0 | 7.23 | 1.540-34.442 | 0.012 |
| Para 1 | 2.57 | 0.856-7.730 | 0.092 |
| Para 2-3 | 1.87 | 0.671-5.204 | 0.232 |
| Para ≥4 (ref) | - | - | - |
| Marital status | |||
| Single | 0.208 | 0.021-2.041 | 0.178 |
| Married | 0.142 | 0.044-0.454 | 0.001 |
| others (Ref) | - | - | - |
| Educational status | |||
| Primary | 1.35 | 0.426-4.275 | 0.61 |
| Secondary | 1.226 | 0.617-2.436 | 0.561 |
| Tertiary (Ref) | - | - | - |
| Do you have any chronic illness? | |||
| Yes | 3.987 | 2.147-7.405 | <0.001 |
| No (Ref) | - | - | - |
| Baby weight >4kg | |||
| Yes | 1.344 | 0.643-2.811 | 0.431 |
| No (Ref) | - | - | - |
| Menopause | |||
| Yes | 1.361 | 0.448-4.132 | 0.578 |
| No (Ref) | - | - | - |
| History of prolonged labour | |||
| Yes | 3.111 | 1.584-6.110 | 0.001 |
| No (Ref) | - | - | - |
| History of prolonged second phase | |||
| Yes | 2.415 | 0.918-6.954 | 0.074 |
| No (Ref) | - | - | - |
Discussion
This was a hospital-based cross sectional study aimed at determining the prevalence, risk factors and find out the health seeking behaviour of women with UI.
The prevalence of UI observed in this study falls within the range of 2.8% to 38.1% reported among non-pregnant women in previous Nigerian studies. 13, 18, 19 However, higher rate have been documented in other countries Turkey (44.6%), France (44%), Germany (41%) United Kingdom (42%) and United states (53.4%).6, 20, 21 This difference might be due to the difference in the study population, location and sample size.
Interestingly, age at first delivery was a risk factor of UI, the younger the women were at first delivery, the more likely they were to develop the condition. This might be due to the increased pressure that has been exerted on the pelvic floor muscles each time of delivery causing weakness of the pelvic support structures 22 because the earlier a woman starts her reproductive career the more likely chance that she will have many children especially in Nigeria where there is high unmet need of family planning.
In addition, prolonged labour was associated with UI and this corroborated previous studies in Nigeria, this is not unexpected because prolonged labour and prolonged second stage of labour causes damage the pelvic support structures due to pressure been exerted on the pelvic floor for a long period and predisposes to UI. 18, 22, 23 This is also not surprising because about 60% of deliveries in Nigeria are at home, or by unskilled personnel, 24 which causes several complications of labour including injuries to the bladder and urethra.
In this study, chronic illness was associated with UI and majority of the women have either diabetic or hypertensive. This is not a new finding because the disease or the medication for its treatment could trigger a high urinary frequency and having any of these illnesses was also one of the factors identified to predispose to UI by Ojengbede et al,19 Sensoy et al, 20 and Erekson et al 25.
The health seeking behaviour of the women with UI is poor in that less than one-fifth of the incontinent women sought medical attention with majority stating that the reason they did not seek medical attention is because UI is not life threatening. This is also reported in different studies. 4, 18, 19, 26 Other reasons are because they are ashamed of the condition, do not believe that treatment is available or afraid of the complications of the treatment despite been attended to by a doctor from whom they can seek help and clarify their fears. On the other hand, when comparing this study with other studies on UI in the same geopolitical zone in Nigeria, there is a little improvement in the number of women that sought medical attention because none of the women in those studies sought for medical intervention. 13, 27 Severity of the symptoms is one of the reasons identified in previous studies as why women seek out for medical attention, conversely in this study majority of the women who leaked urine did so about 8 times a week.26, 27
A higher proportion of the study participant reported symptoms of stress UI which is comparable to other studies, 6, 19, 27, 28 however the study by Ojengbede et al reported a higher proportion (13.7%) of women with urge incontinence in the same environment. 19
Remarkably, mode of delivery and education were not causal factors of UI in this study, although it was observed that majority of those with UI had increased parity and vaginal delivery. Similar trend was also revealed in earlier studies, 19, 25 though, in the study by Ojengbede et al mode of delivery was associated with developing UI. 19 Additionally, it has been documented that the association of UI with childbirth and parity decrease with age. 6, 25
The interpreting of the results of this study must be considered with the limitations. In this study incontinence was defined by self-report by the participants using questionnaires. Urodynamic and clinical evaluation was not done to confirm and characterize the presence or type of incontinence and evidence has shown there could be some wrong diagnosis using only self-report symptoms of urinary incontinence. 29 However, standard questionnaire (Incontinence Questionnaire-Urinary Incontinence-Short Form) which has been shown to be highly reliable in determining UI and correlate with urodynamic report and classification was used thus the study is reliable and reproducible. 30 Furthermore, even though, this study identified the predisposing/risk factors for UI in the study population, it did not predict the aetiology of the UI which is important in the prevention and treatment of the condition.
Conclusion
UI, a condition of public health importance is not uncommon in Nigeria with low age at first delivery, history of prolonged labour and chronic illness identified as predisposing factors. However, most of these women did not report their symptoms despite being attended to by a gynaecologist. There is need to sensitize women of the symptoms and complications associated with urinary incontinence as well as its prevention and need to seek medical care if they have urinary leakage.
References
- 1.Bates P, Bradley W E, Glen E, Griffiths D, Melchior H. (1979) The standardization of terminology of lower urinary tract function. , J Urol 121, 551-554.
- 2.Abrams P, Cardozo L, Fall M, Griffiths D, Rosier P. (2002) The standardization of terminology of lower urinary tract function: report from the standardization sub-committee of the International Continence Society. , Neurourol Urodyn 21, 167-178.
- 3.Abrams P, Andersson K E, Birder L, Brubaker L, Cardozo L. (2010) Fourth International Consultation on Incontinence Recommendations of the International Scientific Committee: Evaluation and treatment of urinary incontinence, pelvic organ prolapse, and fecal incontinence. , NeurourolUrodyn 29(1), 213-240.
- 4.Minassian V A, Drutz H P, Al-Badr A. (2003) Urinary incontinence as a worldwide problem. , International Journal of Gynecology and Obstetrics 82, 327-338.
- 6.Hunskaar S, Arnold E P, Burgio K, Diokno A C, Herzog A R. (2000) Epidemiology and natural history of urinary incontinence. , IntUrogynecol J 5, 301-319.
- 7.Kincade J E, Dougherty M C, Carlson J R. (2007) Factors related to urinary incontinence in community-dwelling women. , Urol Nurs 27, 307-317.
- 8.Abrams P, Cardozo L, Fall M, Griffiths D, Rosier P. (2003) The standardisation of terminology of lower urinary tract function: report from the Standardisation Sub-committee of the International Continence Society. , Urol 61, 37-49.
- 9.Keilman L J. (2011) Urinary incontinence in the older female population. Available from:http://www.clinicaladvisor.com/cmece-features/urinary-incontinence-in-the-older-female-population/article/219016/2/.Accessedon:feb12,2018.
- 10.Nygaard I, Barber M D, Burgio K L, Kenton K, Meikle S. (2008) Prevalence of symptomatic pelvic floor disorders in US women. , JAMA 300(11), 1311-1316.
- 11.Melville J L, Katon W, Delaney K, Newton K. (2005) Urinary incontinence in US women: a population-based study. , Arch Intern Med 165(5), 537-542.
- 12.Gleason J L, Richter H E, Redden D T, Goode P S, Burgio K L. (2013) Caffeine and urinary incontinence in US women. , IntUrogynecol J 24(2), 295-302.
- 13.Badejoko O O, Oyebamiji S B, Awowole I O, Salako A A, Ogunniyi S O. (2016) Urinary incontinence: prevalence, pattern, and opportunistic screening in Ile-Ife. , Nigeria. International Urogynecology Journal 27(2), 269-73.
- 14.Haliloglu B, Karateke A, Coksuer H, Peker H. (2010) The role of urethral hypermobility and intrinsic sphincter deficiency on the outcomeoftransobtrator tape procedure: a perspective study with 2 year follow-up”. International urogycologist journal pelvic floor distinction. 21(2), 173-178.
- 15.Kocak I, Okyay P, Dundar M, Erol H, Beser E. (2005) Female urinary incontinence in the west of Turkey: prevalence, risk factors and impact on quality of life. , Eur Urol 48(4), 634-641.
- 16.Sampselle C M, Harlow S D, Skurnick J, Brubaker L, Bondarenko I. (2002) Urinary incontinence predictors and life impact in ethnically diverse perimenopausal women. , ObstetGynecol 100, 1230-1238.
- 17.Chiaffarino F, Parazzini F, Lavezzari M, Giambanco V. (2003) GruppoInterdisciplinare di Studio IncontinenzaUrinaria (GISIU). Impact of urinary incontinence and overactive bladder on quality of life. , Eur Urol 43(5), 535-8.
- 18.Udokang N E, Inyang O I, Dick S F. (2016) Urinary Incontinency in Women in Uyo Metropolis,South-South,Nigeria. , European Journal of Sustainable Development 5(1), 145-152.
- 19.Ojengbede A O, Morhason-Bello I O, Adedokun B O, Okonkwo N S, Kolade C O. (2011) Prevalence and the associated trigger factors of urinary incontinence among 5000 black women in sub-Saharan Africa: findings from a community survey. , Br J Urol Int 107, 1793-1800.
- 20.Sensoy N, Dogan N, Ozek B, Karaaslan L. (2013) incontinence in women: prevalence rates, risk factors and impact on quality of life. , Pak J Med Sci 29(3), 818-822.
- 21.Markland A D, Richter H E, Fwu C-W, Eggers P, Kusek J W. (2011) . Prevalence and Trends of Urinary Incontinence in Adults in the United States,2001to2008. The Journal of Urology 186(2), 589-593.
- 22.Haliloglu B, Karateke A, Coksuer H, Peker H. (2010) The role of urethral hypermobility and intrinsic sphincter deficiency on the outcome of transobtrator tape procedure: a perspective study with 2 year follow-up”. International urogycologist journal pelvic floor distinction. 21(2), 173-178.
- 23.Marnikovic S P, Rovne E S, Moldwin R M, Staton S L, Gillen L M. (2012) The management of overactive bladder syndrome. , British Medical Journal 17, 344.
- 24. (2013) Nigeria demographic health survey (NDHS), NDHS Final report. Available from:http://dhsprogram.com/publications/publication-fr293-dhs-final-reports.cfm#sthash.V67EQ1mm.dpuf.(Accessed:March28,2018)
- 25.Erekson E A, Cong X, Townsend M K, Ciarleglio M M. (2016) 10-year Prevalence and Incidence of Urinary Incontinence Among Older Women: A Longitudinal Analysis of the Health and Retirement Study. , Journal of the American Geriatrics Society 64(6), 1274-1280.
- 26.Adedokun B O, Morhason-Bello I O, Ojengbede O A, Okonkwo N S, Kolade C. (2012) Help-seeking behavior among women currently leaking urine in Nigeria: is it any different from the rest of the world? Patient Preference and Adherence. 6, 815-819.
- 27.Hannestad Y S, Rortveit G, Sandvik H, Hunskaar S. (2000) A community-based epidemiological survey of female urinary incontinence: the Norwegian EPINCONT study. , Epidemiology of Incontinence in the County of Nord-Trondelag. J Clin Epidemiol; 53, 1150-1157.
- 28.Ijaiya M A, Raji H O, Aboyeji A P, Adesina K T, Adebara I O. (2011) Non-fistulous urinary leakage among women attending a Nigerian family planning clinic. , International Journal of Women’s Health 3, 409-413.
Cited by (4)
This article has been cited by 4 scholarly works according to:
Citing Articles:
PLOS Global Public Health (2022) Crossref
M. Ackah, Louise Ameyaw, M. Salifu, Cynthia OseiYeboah, Abena Serwaa Ampomaa Agyemang et al. - PLOS Global Public Health (2022) Semantic Scholar
PLOS Global Public Health (2022) OpenAlex
PLOS ONE (2020) Crossref
A. A. Ofori, Joseph Osarfo, E. Agbeno, W. Azanu, H. Opare-Addo - PLoS ONE (2020) Semantic Scholar