Abstract
Photorefraction (PR) methods have beenwidely used for pediatric vision screening since the 1980’s. While PR is easy to implement, the accuracy of refractive error measurements in humans has been unsatisfactory, largely due to the variations of intraocular scattering, the retinal reflectance, and pupil size. The objective of our studies was to clinically evaluate the accuracy of refraction measurements of an improved PR-based device, the Dynamic Ocular Evaluation System (DOES), and to investigate whether the accuracy is affected by the patient’s age, race, and pupil size, which are relevant to individual intraocular scattering and retinal reflectance. We performed DOES measurements in 99 volunteers (198 eyes) under two environmental light conditions and using four fixation targets. These results were compared to the standard clinical refraction testing performed the same day. The correlation and standard deviation were determined by Bland-Altman analysis. The influence of intraocular scattering, retinal reflectance, and pupil size was evaluated by comparing results from different age groups, races, and lighting conditions. In the region between -4 diopter (D) and +4D, the device showed a binocular refraction measurement accuracy of 0.45 D, 0.3 D, and 0.18 D root-mean-square (RMS) error (n=1337) for spherical equivalent and cross cylinders Jo and J45, respectively. Inaccuracy increased at high refraction (>4D). Age, race, and pupil size did not appear to significantly affect DOES PR measurement. This suggests that enhancements in the PR system and analysis may satisfactorily correct intersubject variability that currently limits the clinical use of PR devices and measurements.
Author Contributions
Academic Editor: Chang Liu, Johns Hopkins University
Checked for plagiarism: Yes
Review by: Single-blind
Copyright © 2017 Lei Shi, et al
 This is an open-access article distributed under the terms of the Creative Commons Attribution License, which permits unrestricted use, distribution, and reproduction in any medium, provided the original author and source are credited.
Competing interests
The authors have declared that no competing interests exist.
Citation:
Introduction:
Photoscreening (PS) has been a popular objective method for pediatric vision screening because of its simplicity of use 1. A PS measurement involves taking photographs of the eyes at a distance, typically one meter. It does not require careful positioning of the eyes or patient cooperation. In addition to the ease of use, PS is capable of simultaneously detecting multiple amblyogenic conditions including strabismus, optical media opacities, and binocular refractive errors. The evaluation of PS devices in vision screening typically uses pass-fail criteria. The result is therefore strongly influenced by the selected cohort and the pass-fail criteria defined for each abnormality. A less ambiguous means of evaluating a PS device is to determine the accuracy in detecting individual vision abnormalities separately.
The name photorefraction (PR) refers to the refraction measurement made from PS images. PR was introduced in the early 1980s 2, 3, 4 and has since evolved to include different optical systems incorporating infrared video cameras and multiple light sources 5 with improved analytic methods (for review, see Howland, 2009 6). Although PR has been used successfully for accommodation studies 7, 8, 9, it requires careful individual calibration on the tested animals or humans. PR measurement is not sufficiently precise for public screening and is generally considered as means to quickly estimate refraction 1, 10, 11, 12, 13, 14.
PR analysis is based on the double-pass reflex image pattern that is reflected from retina. Factors that can contribute to the uncertainty of the analysis can include the individual’s retinal reflectance, the level of intraocular scattering, and the pupil size, which may vary with age and environment lighting conditions. In addition, many users point out that the PR systems were affected by the subject’s race 13, 14, 15, 16, which could be from differences in retinal pigmentation, and therefore, the reflectance. To reduce the influence from retinal reflectance and the intraocular scattering, improvements were made into a multi-eccentric-meridian PR device, the Dynamic Ocular Evaluation System (DOES). An additional co-axial PS image was acquired in each measurement as a calibration reference. Also an analysis algorithm was applied for an attempt to reduce the scattering noise. The purpose of this study is to evaluate the accuracy (mean error) and precision (error deviation from mean) of refraction measurement of DOES. Measurements were acquired from volunteers in a clinical setting, and DOES measurements were compared to the standard clinical measurements made in the same visit. We further investigated the influence of pupil size, age, and race to identify variables that may interfere with DOES PR measurement accuracy.
Material and Method:
Optics and Analysis Algorithm of DOES
The PR optical theory is described previously 2, 3, 4, 5, 6, 17, 18. Figure 1 briefly summarizes the difference of DOES and other PR systems in the optics (upper figure) and the refraction analysis algorithm (lower figure). The DOES system uses a near-infrared (810 nm) source, multi-eccentricity-meridian video PR method 17, 18 to acquire a sequence of retinal reflex PS images. Using a beam splitter, the camera and light-source array were collimated (as illustrated at the middle right). This allowed a co-axial PS image to be captured and used as a calibration baseline for individual’s retinal reflectance. Each PS image included both eyes. Each pupil was identified from the photograph using a customized image analysis code, and the background (offset) intensity was removed mathematically to reduce the scattering variation. The remaining signal intensities render a two-dimensional Point Spread Function (PSF) of the eye (illustrated at lower right of Figure 1). Without the beam splitter and the resulting co-axial PR intensity, this double-pass PSF would not be accessible. Finally, the astigmatism amplitude and angle were derived using the 2-Dimensional elliptical fitting and the principle axes of the PSF.
Figure 1.Optical arrangement and refraction analysis process. Upper portion shows the optical arrangement of the PR detection. The related light source and camera position are illustrated at the middle right. The lower left-image shows an example of pupil images corresponding to the illumination sources. The lower right-plot shows the double-pass point-spread function (PSF) that is calculated from the relative intensities of the pupil images. The waist of PSF increases with refractive error and is proportional to the pupil size. The fitted principle axes indicate astigmatic axes.
Subjects and Refraction Measurement
155 patients with an age range 4 to 81 years were recruited during their visits for comprehensive eye examinations for eye glasses or contact lens in Walmart Vision Center in Tullahoma, Tennessee. After obtaining informed consent, the volunteers were brought to a testing room to view through a binocular eye-piece a 3D cartoon that is located on a screen at 75 cm. Four refraction measurements were acquired using infrared DOES while the subjects viewed a fixation cartoon figure at 4 different stereo distances that ranged from 75-cm to infinity. To investigate the influences of environment lighting and the consequent pupil-size on the PR measurement, the test was performed twice under the conditions of normal room-light and lights-off. After the cartoon viewing, the patients were returned to their original eye exam schedule. Each eye would generate 8 sets of PR refraction data points under the two environment lighting and four visual stimuli conditions. For comparison, the clinical refraction data were collected. These include data from an autorefractor, which was an average result of three measurements, from the phoropter and trial lenses performed by the optometrist, and from cycloplegic retinoscopy for young children from whom subjective refraction were not feasible.
To prevent error from accommodation, eye data from 56 hyperopic or mildly myopic (Spherical Equivalent > -1 diopter) subjects who were younger than 50 years old were omitted in this refraction evaluation, leaving 99 subjects included in the refraction analysis.
Image and Data Analysis
In the PR measurements, 18.7% of tests were identified to contain images with poor quality due to eye movements or obstruction from the eyelids or eyelashes. Images were filtered with a quality control code based on the circularity, edge sharpness, and significant location-shifting. Since four detections were attempted in each measurement, the rejection rate of refraction measurements is 0.12% = (18.7%)4. In fact, all 198 eyes from the included 99 subject yielded qualified refraction results. In summary, the comparison was able to be made from the 99 subjects, 198 eyes, 1791 data points (OD= 888, OS=903; total n=1791) measured under 4 visual stimuli distances and 2 environment lighting conditions.
Age range: 7-81 years old.
Pupil range: 2.48 to 8.05 mm.
Refraction range: -13.5 to +6.1 diopter
We used both the correlation and the Bland-Altman statistical methods to evaluate agreement between DOES and the clinical gold-standard measurements that were obtained from the optometrist.
Results and Discussion
Overall Refraction Accuracy:
The correlation plots of spherical equivalent (SE) and crossed cylinders (J0 and J45) between the clinical gold standard (x-axis) and the DOES data (y-axis) are shown in the upper three panels of Figure 2. The dashed lines mark the perfect correlation (1:1) and the deviations of ±1 diopter in SE plot and ±0.5 diopter in J0 and J45 plots. The standard deviation of SE and (J0 and J45) within the +4 to-4 diopters region (shaded area in the plots) for vision screening are 0.45, 0.3 and 0.18 diopter, respectively (n=1337). The inaccuracy increases at large refractive error over 4D, which is limited by the eccentricity coverage of this PR system.
The Bland-Altman analysis is shown in the three lower panels of Figure 2. The biases (mean differences) between the binocular DOES and the subjective clinical refraction testing were minimal at 0.00, 0.06, and 0.02 diopter in SE, J0, and J45, respectively.
The monocular autorefractor is currently the most reliable objective refraction tool in the clinical setting. We also compared monocular autorefractor measurements to the clinical subjective refraction results in the same group of 99 patients (198 eyes). The standard errors of the SE were 0.36 diopter and crossed cylinders J0 and J45 were 0.14 and 0.18 diopters, respectively. The mean differences were also minimal (-0.09, 0.03, and -0.04, respectively). The 0.36 D error with 0.09 D mean error is a decent reference. It should be mentioned that each autorefractor data is an average of 3 consequent measurements, which automatically reduces the measurement inaccuracy in each individual. The DOES analysis in this section, however, includes every applicable measurement without taking the average.
Figure 2.Overall binocular DOES refraction test analysis in comparison to clinical gold standard eye exam result. 
Intraocular Scattering in DOES Measurement
The intraocular scattering normally increases with age and as cataracts develop. The onset age of age-related cataract is typically in the 40s. Intraocular scatteringis not only an important problem that reduces contrast of vision, it could also decrease the reliability of ophthalmic measurements. This is especially significant to PR since the measurement relies on the double pass light signal. To examine the influence of intraocular scattering on DOES accuracy, analysis was carried out in three age groups with similar distribution of refraction and pupil size. The details of these 3 age groups are:
1. 20 children from 7 to 15 years old with the total of 38 eyes and 377 tests. The distribution of refractive errors is SE= -1.8 ± 1.0 D. Pupil-size distribution is 5.8 ± 0.9 mm (range from 3.4 to 8.1 mm);
2. 24 young adults from 17 to 38 years old with total of 45 eyes and 434 tests. The distribution of refractive errors is SE= -1.9 ± 0.9 D. Pupil size distribution is 5.2 ± 1.3 mm (range from 2.9 to 7.2 mm);
3. 33 older adults from 41 to 81years old with total of 65 eyes, 525 tests. Distribution of refractive error is SE= +0.3 ± 1.8 D. Pupil size distribution is 4.7 ± 1.0 mm (range from 2.5 to 7.2 mm).
The result in SE, J0, J45, and the total focus errors from the standard exam were shown in Figure 3. The total focus error of a single measurement is defined as the root-mean-square of the three errors (SE, J0 and J45). Judging from the total focus error, the group of young adults was measured by DOES with the greatest accuracy of 0.42 D. The measurements in the group of older adults, had an increased inaccuracy amount of 0.09 D. This result seems to support intraocular scattering influence in older subjects. However, group of children also yielded similar amount of errors at 0.52 D. The result indicates that the small amount of error increased (0.09D) does not provide sufficient evidence to conclude contribution from intraocular scattering to DOES measurement.
Figure 3.Comparison of DOES accuracy in three age groups. The total focus error of measurement is defined as the root mean square of the three errors (SE, J0 and J45)
Pupil Size in DOES Measurement
Pupil size variation has been one of the major difficulties in traditional PR or PS devices. We acquired DOES data in bright and dark environment settings to study the effect of pupil size in measurement accuracy. The older adults’ pupils did not undergo a large enough size change in response to room light conditions and could not be included in the analysis. Therefore, only children and young adult groups were considered in pupil size analyses. The subjects’ distributions in different pupil groups and the results are shown in Figure 4.
Total focus error was 0.47D in small pupils and 0.57D in large pupils in children. In adults, total focus error was 0.45D in small pupils and 0.40D in large pupils. There was no discernable effect of pupil size on accuracy in either age group. The difference of focus error was 0.1D or less between pupil sizes and the tendency was toward opposite directions. Thus, pupil size does not appear to be a significant factor in the DOES refraction measurement.
Figure 4.Comparison of DOES accuracy in smaller and larger pupil groups.
Retinal Reflectance in DOES Measurement
We compared measurement accuracy across races to investigate the influence of retinal reflectance on the double-pass PR technique. The group of 13 non-white subjects included 3 Asians, 3 Hispanics, and 7 blacks. The 42 white subjects were selected for the equivalent age, pupil size, and refraction distribution. The sample conditions of each group and the error analysis results are shown in Figure 5. The result shows that the difference of accuracy between the two groups was merely 0.04D. This investigation of race dependence also showed no significant change in the two groups’ measurement accuracies.
Figure 5.Comparison of DOES accuracy between white and non-white groups.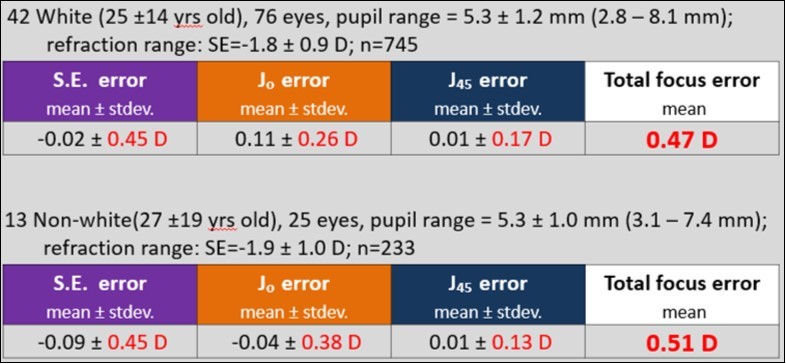
Summary
Pediatric refraction exam is very important, but is very restricted by the poor collaboration in this population. Photorefraction method provides an optional and objective approach for vision assessment. However, the PR measurement is not sufficiently precise and is generally considered as means to quickly estimate refraction. Enhancement of the technology and well understanding of the results could ease the diagnosis and treatment in clinical practice. This study describes the three major sources of the inaccuracy in PR measurement. Two modifications of a PR device, DOES, are made: a coaxial illumination to balance the individual’s retinal reflectance and a mathematic method to reduce the offset noise signal, which is assumed to be relevant to intraocular scattering. We evaluate the quantitative accuracy of DOES and examines the influence of age, race, and pupil size on measurement accuracy. We found that in the pediatric vision screening region between -4D and +4D, the device shows a binocular-refraction measurement accuracy that is indicated by standard errors 0.45D, 0.3 D, and 0.18 D (n=1337) for spherical equivalent and cross cylinders Jo and J45, respectively.
The accuracy of the modified PR device did not indicate significant influence by the race, age, pupil-size, or type of refraction. The measurement total focus error in the distinguished subject groups were fundamentally the same, around 0.48 +/- 0.06D. This suggests that the enhancements in the PR system and analysis may correct for intersubject variability that limits current PR devices and measurements.
Acknowledgements
The authors would like to acknowledge the UTRF maturation funding support, the support and consultation from Dr. Palmer and Walmart Vision Center at Tullahoma, Tennessee, and the support of Center for Laser Applications of the University of Tennessee Space Institute.