
Impact of Agricultural Land Use Practices on Water Quality in Lubigi Wetland
Abstract
Wetland encroachment due to agricultural land use practices (LUPs) adversely affects water quality in wetlands mainly through agricultural runoff. This study was conducted in Lubigi wetland in Uganda to (1) determine the effect of the agricultural LUPs on water quality and (2) understand the relationships between different water quality indicators and different agricultural LUPs existing in the wetland. The eight LUPs included in this study were perennial crops i.e. banana farming and sugarcane farming, annual crops i.e. maize farming and tomato farming, livestock farming which included a mixture of cows, goats, and sheep, undisturbed dense natural vegetation, reference wetland and the river. Water samples collected from the different LUPs were analyzed in the laboratory for selected physicochemical and biological water quality parameters. The water samples were analyzed for a variety of properties, including pH, electrical conductivity, total hardness, Ca-hardness, Mg- hardness, and concentrations of dissolved oxygen, calcium, magnesium, fluoride, total nitrogen, nitrates, ammonium, phosphates, potassium, total coliform, and Escherichia coli (E. coli), chemical oxygen demand, biological oxygen demand, total organic carbon, total dissolved solids, chlorides, sulphates, total phosphorus, and turbidity levels. The results suggested that the different LUPs influenced several water quality parameters. Dissolved oxygen was lowest in banana fields and the river at 2.57 mg/L and 3.44 mg/L respectively than other LUPs which limits survival of aquatic organisms. Biological oxygen demand, chemical oxygen demand and total organic carbon were high in the river water with values = 69.67 mg/L, 351.67 mg/L, 117.33 mg/L respectively indicating high organic pollution. We detected nutrient pollution in water from tomato and sugarcane fields which showed high concentrations of nitrates. The concentration of ammonium in river water (10.40 mg/L) was high, indicating nitrogen contamination. In all LUPs, Escherichia coli and total coliforms had high counts exceeding 2000 CFU/100mL which indicated elevated microbial pollution from livestock waste and agricultural runoff. Cluster analysis revealed distinct clusters influenced by varying water quality parameters. These findings show that agricultural LUPs in Lubigi wetland are significantly contributing to water pollution through microbial contamination, nutrient, and organic matter accumulation, which increases the potential for eutrophication and renders the water unsafe for drinking and domestic use. Implementing best management practices (BMPs) is essential for the sustainable use and management of the wetland.
Author Contributions
Academic Editor: Jayanta Das, Department of Geography, Rampurhat College, PO- Rampurhat, Dist- Birbhum - 731224, India
Checked for plagiarism: Yes
Review by: Single-blind
Copyright © 2025 Christine Atugonza, et al
 This is an open-access article distributed under the terms of the Creative Commons Attribution License, which permits unrestricted use, distribution, and reproduction in any medium, provided the original author and source are credited.
Competing interests
The authors have declared that no competing interests exist.
Citation:
Introduction
Wetlands are a significant part of the ecosystem that play environmental and socio-economical roles by offering ecosystem services and products 1, 2. Wetlands support livelihood through flood regulation, purification of water for domestic use, fuel, carbon sequestration, wildlife habitat, provision of food, farmland, and biodiversity conservation 3, 4. Wetlands include flood plains, papyrus swamps, marshes, bogs, flooded swamps that are both seasonal and permanent 3.
The earth's surface comprises approximately 6% of wetlands but these wetlands have experienced a drastic decline with a 50% loss, and the remaining wetlands are increasingly encroached upon due to population pressure thus impacting their functionality 3, 4, 5, 6. In China, over 30% of natural wetland ecosystem has also been destroyed from 1900 to 2000 7. Today as a result of wetland encroachment, surface water resources that include wetlands face a higher threat of contamination of organic and inorganic materials from both point and non-point sources that subsequently lead to water degradation 8. Enriching wetlands through agricultural LUPs can significantly impact nutrient surface runoff into wetlands potentially degrading water quality 9, 10, 11. This agricultural runoff contains nutrients such as nitrogen (N) and phosphorus (P) originating from chemical fertilizers, pesticides, erosion, organic matter, sediment deposition, and animal feces contributing to eutrophication and promoting algal growth 11, 12, 13, 14.
In East Africa numerous cases of eutrophication have been observed in wetlands such as the Usangu Wetland in Tanzania characterized by N and P enrichment resulting from the excessive use of chemical fertilizers and pesticides 15. This increased water pollution renders water unsafe for human consumption, posing health risks and disrupting the ecological functions of wetlands 16, 17.
Historically, over 13% of Uganda’s land cover (29,000 sq. km) was occupied by wetlands. In 2016, it was discovered to have reduced to 10.9% due to continuous encroachment 18. Lubigi wetland situated Northwest of Kampala City and extending into Wakiso District in Uganda covers an approximate drainage catchment area of 40 km². It is recognized as the largest wetland in the Lake Kyoga drainage basin within the Central region. The wetland has an irregular shape with feeder arms extending towards Busega, Kyengera, Buloba, and Sentema draining into River Mayanja and ultimately into Lake Kyoga. Currently, Lubigi wetland faces increasing threats from encroachment due to the expansion of both agricultural and non-agricultural LUPs 19, 20. Agricultural LUPs in this wetland include the cultivation of both annual and perennial crops and livestock rearing. Non-agricultural LUPs include bricklaying, industrialization, urbanization, construction of power transmission line for Bujagali station from Kawanda to Mutungo, and Northern Bypass from Busega to Bwaise. In 2009, Lubigi wetland area was estimated to have reduced from 489 ha to 85 ha due to the introduced LUPs 21. The primary cause of this degradation is wetland encroachment driven by the growing human population and urban development which increase the demand for agricultural land 22. These currently introduced LUPs lower the wetland’s performance on natural filtration capacity, nutrient cycling, flood management and aquatic habitat protection.
Due to the increased deterioration of Lubigi wetland resulting from anthropogenic activities and poor management of agricultural drainage, monitoring of the physicochemical and biological water quality parameters is needed to understand the extent of water contamination. These water quality parameters indicate contamination through nutrient levels, pollutants, and salinity in the water 23, 24. Despite its critical role in natural water filtration, flood regulation, and providing habitat for biodiversity, no comprehensive research to the best of our knowledge has investigated the impact of agricultural LUPs on the water quality of Lubigi wetland and adjacent water resources such as rivers, lakes, and streams, considering physicochemical and biological indicators. The objectives of this study were 1) to determine the effects of introduced agricultural LUPs on selected water physical, chemical and biological parameters in Lubigi wetland and 2) to understand the relationships between different water quality indicators and agricultural LUPs existing in the wetland.
Materials and Methods
Study area description
This study was conducted in Lubigi wetland in Nkokonjeru and Bulenga village, Wakiso district in central Uganda (0°19’36.0” N, 32°31’12.0” E) (Figure 1). Lubigi wetland at a general elevation of 1158 m above sea level 21 has a gently sloping topography. The wetland forms an irregular semi-circular shape around Kampala city and consists of feeder arms that stretch along the Kampala-Mityana Road towards Buloba, along the Kampala-Masaka Road towards Kyengera, and Sentema Road (Figure 1). The study area is characterized by a wet and dry climate typically tropical with two rainy seasons from September to December and March to May and total rainfall of 1200-1700 mm per year. The daily mean temperature ranges from 15 °C to 30 °C 25. The wetland discharges its water into the River Mayanja, a significant river that constitutes a portion of the Lake Kyoga drainage basin. River Nalukolongo also contributes to the Lubigi wetland in the southeastern region, forming an integral part of the Mayanja-Kato system in the southwestern area 21. Part of the natural vegetation in the Lubigi wetland has been cleared for farming, settlements, livestock keeping, industrialization, and road construction resulting in the degradation of the wetland 3, 18. Among the key land uses introduced into this natural ecosystem include the cultivation of perennial crops such as sugarcane (Saccharum officinarum) and bananas (Musa spp) as well as annual crops such as maize (Zea mays L) and tomatoes (Solanum lycopersicum) and livestock farming.
Figure 1.Map showing the study area and sampled sites-Lubigi wetland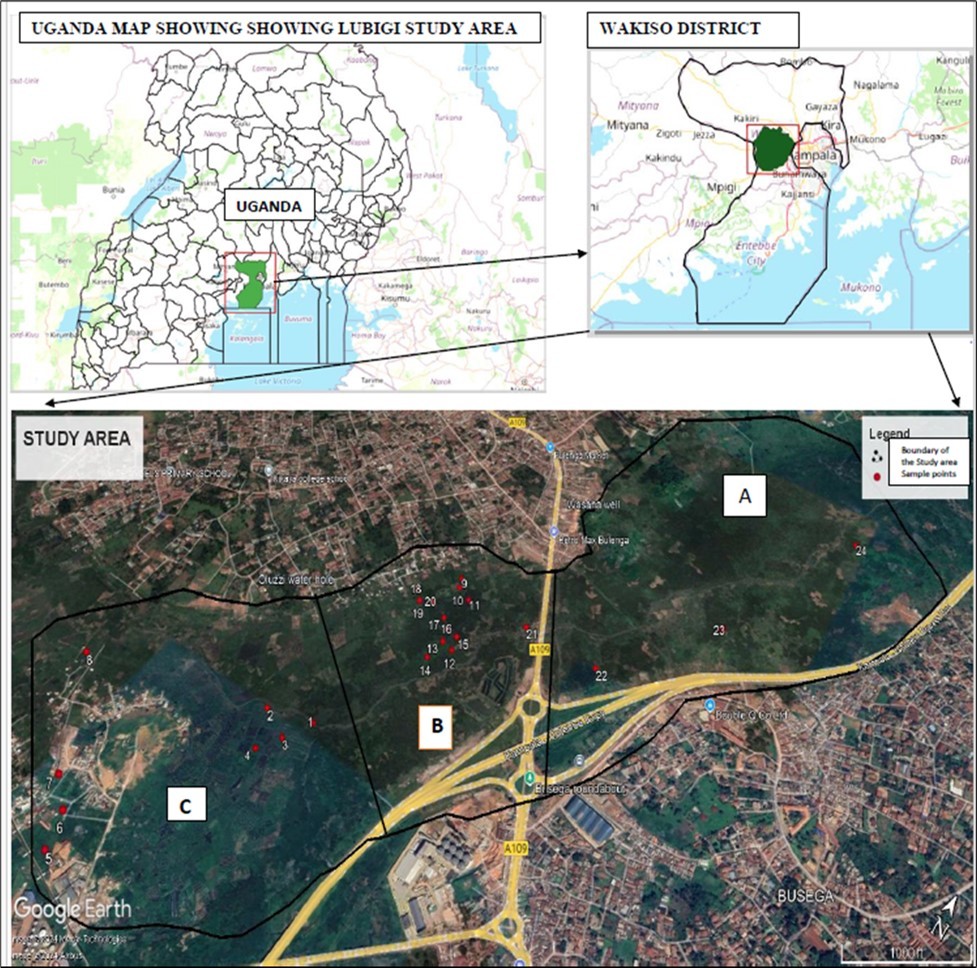
Field selection and water sampling
Field selection
Before field water sampling reconnaissance surveys were conducted in September of 2024 across the Lubigi wetland to assess existing land use, study hydrological patterns, and identify potential water sampling locations. Secondary data like research articles and papers were also gathered from both published and unpublished sources in Google Scholar and Web of Science. The Lubigi wetland was mapped using Google Earth and QGIS enabling the delineation of the study area, identification of wetland boundaries, determination of sampling points, and analysis of its hydrology. The Digital Elevation Model (DEM) was generated from stereo imagery captured by Airbus Defense and spatial data sets such as rivers, roads, and districts were obtained from the Uganda National Bureau of Statistics (UBOS). The stratified sampling strategy was developed based on the land use type, topography, vegetation cover, and hydrology of the given wetland section 26. For instance, the upper area of transect A is undisturbed and dominated by submerged aquatic vegetation which is naturally growing paper reed (Cyperus papyrus) and was considered a reference wetland (Ref. wetland) in this study. In contrast, transects B and C are dominated by agricultural practices such as perennial farming of sugarcane and banana, annual farming of maize and tomatoes, livestock rearing and water networks.
Water sample collection
Stratified random sampling was used to select five major land use types (LUTs) within the wetland: perennial cropping, annual cropping, livestock farming, undisturbed areas, and river areas. These categories were further classified into eight distinct LUPs: perennial LUPs which included banana farming and sugarcane farming; annual cropping LUPs included maize farming and tomato farming; livestock farming which included a mixture of cows, goats, and sheep; undisturbed areas characterized by dense natural vegetation dominated by papyrus extending inward from the agricultural zone and the reference wetland which has remained completely undisturbed by human activities; and river areas that meander through the wetland ecosystem ultimately draining into a large river. The agricultural practices under consideration in this study have been implemented in this wetland area for over five years.
The Garmin Global Positioning System (GPS) device was used to geo-reference the transects and sampling points ensuring accurate location determination. Water samples from perennial and annual fields were taken from detained surface water flowing at very low flow velocities through the fields to their edges, livestock water samples were taken from runoff through grazing areas, river samples were obtained from river water columns and undisturbed samples were obtained from permanent and seasonal pools within the dense vegetation and reference wetland.
Before sampling, all personnel wore gloves to avoid contamination. Sampling containers used to collect physiochemical analysis samples were first rinsed three times with sample water to ensure free contamination of the container. For each sample, the composite sampler was lowered at a depth of 0-1 m to collect the water sample which was transferred to the sampling container. To obtain a composite representative sample from the water column, three individual samples were mixed within a sampling distance of 1-5 meters from each site. In each practice, three positions upper, middle, and lower were sampled resulting in 24 samples for physicochemical analysis and another 24 samples for microbiological analysis (8 LUPs x 3 positions) (Table 1). The samples for physicochemical analysis were collected in 1.5 Litre sized bottles while the samples for microbiological analysis were collected in 500 ml sterilized plastic sampling containers. The containers were labeled with identification codes that included location details using the GPS, time, land use practice, sample ID and initials of the person who took the sample. The samples were immediately kept in a cool box at 4 °C temperature during the day to preserve them and then transported to the National Water Quality Reference Laboratory (NWQRL) for analysis. Overall, 3 sites were selected in transect A, 13 sites in transect B, and 8 sites in transect C (Figure 1; Table 1).
Table 1. Sampling plan of the study| LAND USE | PERENNIAL | ANNUAL | LIVESTOCK | RIVER | UNDISTURBED | |||
|---|---|---|---|---|---|---|---|---|
| WATER SITES | Banana (B) | Sugarcane (S) | Maize (M) | Tomato(T) | Livestock (L) | River (R) | Dense vegetation(DV) | Ref. Wetland |
| Upper | BIC | S1B | M1B | T1B | L1C | R1B | DV1B | RW1A |
| Middle | B2C | S2B | M2B | T2B | L2C | R2C | DV2B | RW2A |
| Lower | B3C | S3B | M3B | T3B | L3C | R3C | DV3B | RW3A |
Water analysis and procedure
Throughout the sampling process in-situ measurements for temperature, electrical conductivity (EC) and pH were taken using the Wissenschaftlich-Technische Werkstatten (WTW) portable water probes calibrated on the field day using a reference temperature set at 25 °C. The gravimetric method was used to measure the total dissolved solids (TDS) (ASTM D 5907-13). The TDS was calculated by filtering a 100 ml sample using a 0.45 µm membrane filter, letting it evaporate at 180°C and then weighing the residue 27. Turbidity was measured using the Nephelometric Method with a Tungsten Lamp Turbidimeter (Model: Hach TL2350). Briefly, a 20 ml blank sample was put in the Nephelometric cell, agitated, and immersed in the ultrasonic basin for about 2 s. The turbidity values were read directly from the instrument display in Nephelometric Turbidity Unit (NTU) units 28. Total hardness was determined using the titration method Ethylenediaminetetraacetic acid (EDTA) where ammonia buffer was added to 50 ml of sample to adjust the pH followed by the addition of 2 drops of Erichrome Black T until the color changed from blue to pink. The endpoint was determined by color change which indicates the presence of magnesium and calcium ions 29.
Total P (TP), phosphates (PO43--P), nitrates (NO3--N), sulfates (SO42-), Total N (TN), and ammonium (NH4+-N) were measured using a covert photometric analyzer (Model: Thermoscientific Gallery Plus). For NH4+-N, 10 ml of sample was mixed with 1 ml of each of the reagents: sodium dichloroisocyanurate, sodium salicylate, and sodium hydroxide (ISO 7150) 30. The NO3--N were determined by mixing a 10 ml sample with 1 ml of hydrazine (SM 4500-NO3- H) 31. The standard barium chloride method (SM4500 SO4-E) was used to analyze SO42- which involved mixing a 10 ml sample with 1 ml of barium chloride solution 32. The PO43--P were determined by mixing 10 ml of the sample with 1 ml of ammonium molybdate and 1 ml of antimony potassium tartrate in an acidic environment followed by an ascorbic acid reaction. All the mixtures were incubated for 15 minutes at room temperature followed by measurement of absorbance in the blue-colored solution at 660 nm, yellow-colored solution at 520 nm, turbid white solution at 420 nm and blue-colored solution at 880 nm for NH4+-N, NO3--N, SO42-, PO43--P respectively. The absorbance was used to determine concentrations using calibration curves 33.
Chlorides (Cl) were determined using the standard Mercury (II) thiocyanate method (SM 4500 Cl-E) where Cl reacts with mercury (II) thiocyanate to form non-ionized (but soluble) mercury (II) chloride and an equivalent amount of free thiocyanate, which forms a red complex with iron (III) and measured at 480 nm 34. Fluorides (F) were analyzed by adding 1 ml of Alizarine fluorine blue and cerous nitrate method (SM 4500 F-E) to a water sample, mixed well and incubated for 30 minutes to allow color development. The concentration of F was measured at an absorbance of wavelength of 620 nm 35. Calcium (Ca) and Magnesium (Mg) were determined using the EDTA titration method 36. For Ca, 2 drops of Murexide indicator titrated with EDTA solution were added until the color changed from pink to blue. For Mg, titration was performed until the solution turned from blue to red. The volume of the EDTA solution was used to calculate the concentration of both Ca and Mg. Potassium (K) was determined using flame photometry (Model BWB flame photometer) where a 50 ml sample was diluted with distilled water followed by preparation of K standard solution by dissolving 1.907 g of KCl dried at 110 °C and then diluted to 1000 ml with water. Stepped amounts of K solution ranging from 0 to 100 mg/L were prepared and emission intensity was determined at 766.5 nm 37.
Lead (Pb) and Arsenic (As) were measured simultaneously using an inductively linked plasma-optical emission spectrometer (ICP-OES, model: Perkin Elmer Optima 7000 DV) where a 10 ml sample was digested using 2 ml of concentrated nitric acid (HNO3) and 10 ml of hydrochloric acid (HCl) and heated at 200 °C. The concentration of Pb and As in the digested samples (2ml) were read using the Inductively Coupled Plasma instrument at 220.35 nm and 193.7 nm wavelength respectively. The final concentration was determined using the calibration curve 38.
Dissolved oxygen (DO) was taken using the WTW portable water probes calibrated on the field day using a reference temperature set at 25 °C 39. The biological oxygen demand (BOD) was determined using dilution technique 5210B which started by measuring the initial DO of the sample. Briefly, 2 ml of the sample was poured on the membrane filter that was placed on a petri dish containing a nutrient-rich agar medium that supports the growth of bacteria then incubated at 35-37 °C for 12-24 hours. The final DO was measured after 5 days, and BOD was obtained by calculating the difference between the initial and final DO which was divided by the dilution factor (ratio of sample volume to total volume of diluted sample) 40. The chemical oxygen demand (COD) was determined using the closed reflux dichromate method which involved refluxing a 10 ml sample in a highly 2 ml acidic solution containing a 5 ml excess of potassium dichromate (K2Cr2O7). The mixture was cooled, 2 drops of ferroin indicator were added and titrated with ammonium sulphate until the color change from green to reddish brown was obtained and COD was calculated as follows 41:

Where:
B = ml ammonium sulphate for sample,
A = ml ammonium sulphate for blank,
M = molarity of ammonium sulphate, and
8000 = milliequivalent weight of oxygen × 1000 ml /l
Organic Carbon (TOC) was determined from the COD using a proven empirical relation considering a factor of 3 O2.

Total coliforms and E. coli were determined using the membrane filtration technic where a water sample was poured on the membrane filter on the filter apparatus followed by applying gentle vacuum pressure to the filter sample. The filtered membrane was put on the surface of the E. coli which was confirmed with blue and pink for total coliforms after incubation for 18 hours at 35 °C 42.
Statistical analysis
The data collected was first cleaned using Microsoft EXCEL. Shapiro-Wilk test was deployed to examine data normality. To determine the effects of different LUPs on water quality parameters, we employed One-way Analysis of variance (ANOVA) and linear mixed effects models in R. In addition to the Shapiro-Wilk test, model assumptions were further evaluated using residual plots. In the linear mixed effects model, water quality parameters were treated as independent response, LUP was considered as a fixed effect and block was treated as random effect to account for spatial variability. Pearson correlation analysis using the corrplot and ggplot was conducted in R to examine linear relationships between parameters. To reduce dimensionality of the dataset and to determine the relationship between water quality parameters as related to the different LUPs, a principal component analysis (PCA) using prcomp from the factoextra" package and visualized with fviz_pca_biplot function from the factoextra package were performed 43. The p-values < 0.05 indicated a significant difference between the groups. The R statistical package was used to perform all statistical analyses 44. For Hierarchical clustering, all water quality variables were standardized to zero mean and unit variance. Euclidean dissimilarity matrix was computed with the dist () in R and hierarchical clustering was performed using Ward’s minimum‐variance criterion (ward. D2) with hclust () in R. The number of the clusters was determined based on k-means clustering using average silhouette method and elbow method, which cut the clustering tree Kmeans (K) =3 as acceptable.
Results
Effects of land use practices on dissolved oxygen, chemical oxygen demand, biological oxygen demand and total organic carbon
The concentration of DO varied significantly across the different LUPs. The concentration of DO in annual fields was on average greater than in perennial cropped and undisturbed areas. The DO concentrations were significantly higher in tomato fields (8.79 mg/L) and significantly lower in banana plantations (2.57 mg/L). The concentration of DO in the remaining LUPs did not vary significantly with DO ranging from 3.44 mg/L to 6.67 mg/L (Figure 3). The concentrations of COD, BOD and TOC did not significantly vary in water sampled from the various LUPs. The COD ranged between 351.67 mg/L from river water and 72.33 mg/L from water sampled from livestock areas while BOD was highest in the river water (69.67 mg/L) and least in water sampled from maize fields (11.67 mg/L). The highest TOC concentration was found in the river water (117.33mg/L) while the lowest TOC was found in water sampled from livestock areas (24.33 mg/L). The TOC concentration in the other remaining LUPs averaged at 31.39 mg/L (Table 2).
Table 2. Effect of land use practices on Dissolved Oxygen, Chemical Oxygen Demand, Biological Oxygen Demand and Total Organic Carbon| Group | Land Use Type | Dissolved Oxygen (mg/L) | Chemical Oxygen Demand (mg/L) | Biological Oxygen Demand (mg/L) | Total Organic Carbon (mg/L) |
| Annual | Maize | 5.51ab | 79.33a | 11.67a | 26.33a |
| Tomatoes | 8.79b | 85.67a | 23.33a | 28.67a | |
| Perennial | Banana | 2.57a | 135.00a | 32.33a | 45.33a |
| Sugarcane | 6.66ab | 88.00a | 42.67a | 29.33a | |
| Undisturbed | Vegetation | 5.54ab | 87.00a | 13.20a | 29.00a |
| Ref. Wetland | 5.62ab | 89.33a | 28.33a | 29.67a | |
| Livestock | 6.02ab | 72.33a | 16.17a | 24.33a | |
| River | 3.44ab | 351.67a | 69.67a | 117.33a | |
| SEM | 1.24 | 87.45 | 14.86 | 29.13 | |
| P- value | 0.08 | 0.38 | 0.19 | 0.38 |
Effects of land use practices on turbidity, Ca-hardness, Mg-hardness, total hardness, and total dissolved solids
The physical water quality parameters (turbidity, Mg-hardness, total hardness, and TDS) were not affected by LUPs except for Ca-hardness (Table 3). We obtained very high turbidity (122.00 NTU) levels in water sampled from the Ref. wetland in comparison with water sampled from annual and perennially cropped areas although these were not statistically significant. The highest Ca-hardness (99.67 mg/L) was recorded in water sampled from the Ref. wetland while the least Ca-hardness was obtained in water sampled from sugarcane fields (59.67 mg/L). The remaining LUPs showed similar Ca-hardness concentrations ranging from 63.33 mg/L to 84.67 mg/L. Across all LUPs, Mg-hardness ranged between 18.67 mg/L to 38.00 mg/L, total hardness ranged between 90 mg/L to 130.33 mg/L and TDS ranged between 215.60 mg/L to 554.87 mg/L (Table 3).
Table 3. Effect of land use practices on water quality physical parameters| Group | Land Use Type | Turbidity (NTU) | Calcium hardness (mg/L) | Magnesium hardness (mg/L) | Total hardness (mg/ L ) | Total Dissolved Solids (mg/L) |
| Annual | Maize | 18.67a | 84.67ab | 18.67a | 103.33a | 280.47a |
| Tomatoes | 11.07a | 74.67ab | 29.67a | 104.33a | 295.63a | |
| Perennial | Banana | 19.67a | 74.67ab | 33.67a | 108.33a | 252.00a |
| Sugarcane | 42.87a | 59.67a | 38.00a | 97.67a | 215.60a | |
| Undisturbed | Vegetation | 13.67a | 77.33ab | 27.67a | 105.00a | 275.57a |
| Ref. Wetland | 122.00a | 99.67b | 30.67a | 130.33a | 346.03a | |
| Livestock | 23.67a | 63.33ab | 26.67a | 90.00a | 241.27a | |
| River | 61.67a | 84.33ab | 35.67a | 120.00a | 554.87a | |
| SEM | 26.21 | 7.89 | 4.09 | 8.76 | 72.83 | |
| P- value | 0.12 | 0.06 | 0.08 | 0.12 | 0.08 |
Effects of land use practices on pH, electrical conductivity, cations, and anions
The pH differed significantly in water sampled from different LUPs. The pH values were highest in the first group with livestock and tomato fields, followed by the second group with Ref. wetland and the river water. The pH in the other LUPs averaged at 6.9 which was lower than those in the two above-mentioned groups (Figure 2). The EC significantly varied across the LUPs with river water having the highest EC (792.67 µS/cm) compared to all other LUPs that averaged at 389.09 µS/cm (Figure 2).
Figure 2.Effect of land use practices on soil pH and electrical conductivity.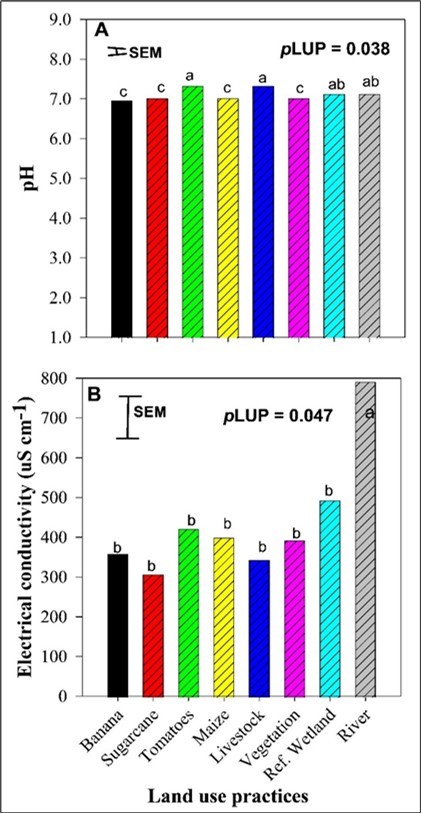
The concentration of both cations of Ca and Mg in water was marginally affected by different LUPs (Table 4). The highest Ca concentration was found in the Ref. wetland (40 mg/L) while the lowest was obtained in water sampled from sugarcane fields (23.67 mg/L). In contrast, the highest concentration of Mg was found in water sampled from sugarcane fields (9.00 mg/L) while the lowest was recorded in water sampled from maize fields (4.33 mg/L). The Ca and Mg concentrations in the remaining LUPs were not different and averaged at 30.50 mg/L and 7.39 mg/L for Ca and Mg respectively (Table 4).
The concentration of anions (Cl and SO42-, F) was not affected by different LUPs except F (Table 4). The highest concentration of F was found in Ref. wetland (0.59 mg/L) and the lowest (0.38 mg/L) in water sampled from banana plantations. The concentration of F in water sampled from other LUPs did not differ and ranged between 0.41 mg/L to 0.58 mg/L. The concentration of Cl varied between 125 mg/L and 29.00 mg/L. The concentration of SO42- ranged between 9.03 mg/Land 1.77mg/L (Table 4).
Table 4. Effect of land use practices on water quality chemical parameters| Group | Land Use Type | Calcium (mg/L) | Magnesium (mg/L) | Flouride (mg/L) | Chloride (mg/L) | Sulphate (mg/L) |
| Annual | Maize | 34.00ab | 4.33a | 0.58ab | 35.67a | 2.33a |
| Tomatoes | 29.67ab | 7.33ab | 0.44ab | 39.67a | 9.03a | |
| Perennial | Banana | 29.67ab | 8.33ab | 0.38a | 29.00a | 1.77a |
| Sugarcane | 23.67a | 9.00b | 0.41ab | 29.67a | 5.50a | |
| Undisturbed | Vegetation | 31.00ab | 6.67ab | 0.43ab | 36.67a | 6.40a |
| Ref. Wetland | 40.00b | 7.33ab | 0.59b | 44.67a | 4.00a | |
| Livestock | 25.00ab | 6.33ab | 0.51ab | 37.00a | 2.73a | |
| River | 33.67ab | 8.33ab | 0.41ab | 125a | 2.90a | |
| SEM | 3.15 | 0.96 | 0.04 | 29.39 | 2.27 | |
| P- value | 0.05 | 0.07 | 0.01 | 0.35 | 0.36 |
Effects of land use practices on mineral N, P, K, total coliform, and Escherichia coli
The concentrations of TN, NH4+-N, and NO3--N significantly differed with LUPs. River water and water sampled from livestock areas had higher TN (average =10.83 mg/L) compared to all the remaining LUPs (average = 4.67 mg/L). Unexpectedly, the lowest TN was found in water sampled from maize fields. The concentrations of NO3--N were in the order of tomatoes > sugarcane > vegetation. There were no statistical differences in NO3--N in the other five LUPs. River water had the highest NH4+-N (10.40 mg/L) concentrations that greatly differed from the remaining LUPs (Figure 3).
The concentration of TP was not influenced by different LUPs. Water collected from banana plantations and river had the highest concentration of TP while the lowest concentration of TP was found in water sampled from livestock areas although these were not statistically different from other LUPs. The concentrations of TP ranged between 1.12 mg/L to 0.25 mg/L (Figure 3). Despite similar trends with TP, the concentrations of PO43--P in water varied significantly with LUPs, with the highest concentrations found in the river water (0.95 mg/L) and the lowest in water sampled from livestock areas (0.08 mg/L). All the remaining LUPs had similar concentrations of PO43--P ranging from 0.28 mg/L to 0.81 mg/L (Figure 3).
The concentration of K in water significantly varied with high values observed in water sampled from tomato fields and the lowest (10 mg/L) in water sampled in livestock areas. Importantly, we noted that the high concentration of K in tomato fields was twice that found in water sampled from livestock areas. As for the other LUPs, K concentrations did not differ significantly with values ranging from 15.67 mg/L to 19.33 mg/L (Figure 3). Total coliform and Escherichia coli (E. coli) in water were not affected by LUPs, with both counts being > 2000 for water sampled from all LUPs in this study.
Figure 3.Effect of land use practices on total and mineral N, P, K levels in water.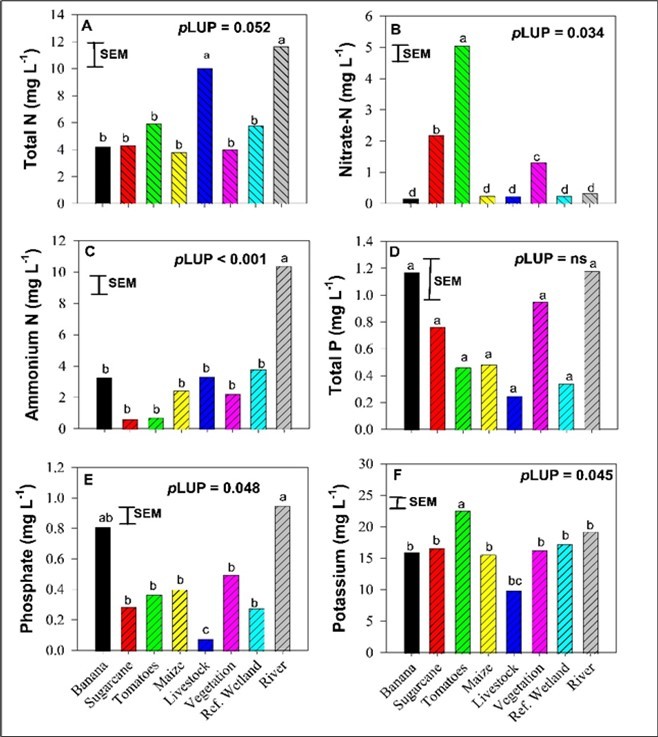
Relationships between land use practices and water quality parameters
Pearson correlations revealed several relationships among water quality parameters (Figure 4). Chloride concentrations showed positive correlations with EC, TDS, NH4+-N, TOC, and COD. The concentration of EC had a strong positive correlation with Cl, TDS, NH4+-N, TOC, and COD. The concentration of TDS was positively related to the concentrations of Cl, NH4+-N, TOC, and COD, and EC. The concentration of COD was strongly and positively correlated to Cl, TDS, NH4+-N, TOC, and EC. Phosphate concentration was strongly and positively related to TP while TOC was positively related to COD, NH4+-N, Cl, TDS, and EC (Figure 4). The concentration of NH4+-N was positively related to Cl, EC, TDS, TOC, and COD. Negative correlations were also identified. The PO43--P was strongly and negatively correlated with DO. Total P was strongly and negatively correlated with the concentrations of F. Total hardness was strongly and negatively correlated with the concentration of Ca and Ca- hardness. The concentrations of NO3--N was negatively correlated with total hardness while the concentration of F was strongly and negatively correlated with the concentration of Mg (Figure 4).
Figure 4.Correlation between water physicochemical parameters. The color intensities show the correlation coefficient where red implies positive correlation and blue implies negative correlation.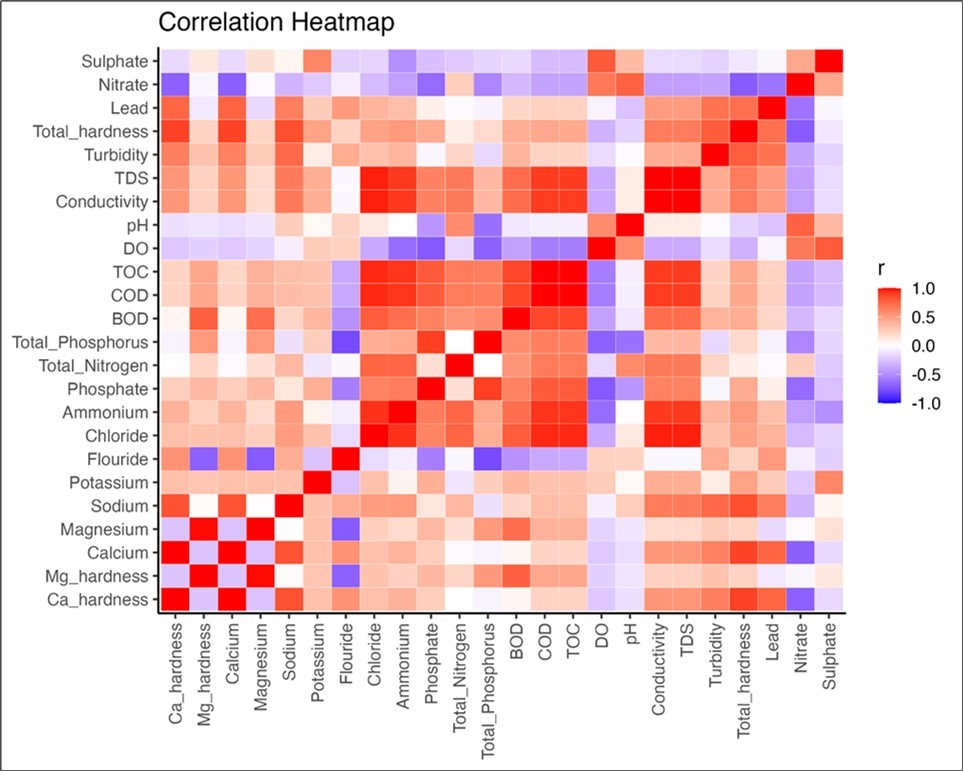
The Principal Component Analysis (PCA) revealed that the eight LUPs: banana, livestock, maize, river, sugarcane, tomato, Ref. wetland, and vegetation impacted physical and chemical water quality parameters (Figure 5). Maize strongly influenced the concentrations of F but negatively affected the concentrations of Mg, Mg-hardness, TP, PO43--P, Cl, BOD, TDS, NH4+-N, TN, TOC, and COD. Livestock, sugarcane, vegetation, and tomato LUPs positively affected DO, pH, SO42- and NO3--N but negatively influenced Ca and Ca-hardness, Pb, Na, turbidity, EC, and total hardness. Ref. wetland positively influenced Ca and Ca-hardness, Pb, Na, turbidity, EC, and total hardness but negatively influenced SO42- and NO3--N. River positively influenced most water quality parameters including PO43--P, TOC, COD, Cl, TN, TDS, NH4+-N, and EC but negatively influenced pH, DO, and SO42- (Figure 5). Banana practices positively influenced Mg, Mg-hardness, and TP but negatively influenced the concentration of F.
Figure 5.Principle Component Analysis (PCA) biplot demonstrating correlations between land use practices (banana, sugarcane, maize, tomatoes, livestock, river, Ref. wetland and vegetation) and water quality parameters.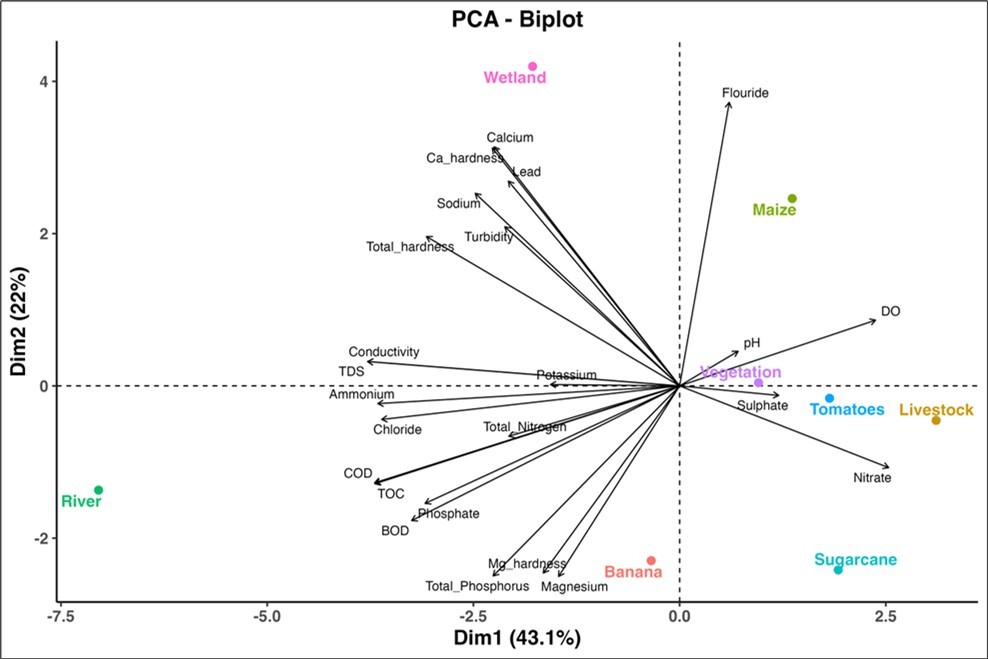
Optimal number of clusters showed the average silhouette width (ASW) for each choice of k, used to define clusters. Peak at K = 3, indicated that highest width occurs when the tree is cut into three clusters. Our results indicated cluster 1 with river only, cluster 2 with Ref. wetland only and cluster 3 with tomatoes, maize, vegetation, banana, sugarcane and livestock. Overall, different clusters were driven by different water quality parameters. Cluster 1 (river) was associated with higher levels of Cl (Z score (Z) = 2.44), COD (Z score = 2.425) and TOC (Z = 2.424). Cluster 2 (Ref. wetland) was driven by elevated levels of turbidity (Z = 2.21), Na (Z=1.85) and total hardness (Z = 1.82). Cluster 3 (tomatoes, maize, vegetation, banana, sugarcane and livestock) were characterized with elevated NO3--N, DO and SO42- (Z = 0.256, 0.173 and 0.119) respectively (Figure 6). Cluster 1 (livestock, tomatoes, maize, vegetation, banana, and sugarcane) was characterized with elevated NO3--N, DO and SO42- with z-score = 0.256, 0.173 and 0.119 respectively.
Figure 6.Cluster analysis of water quality parameters across different land use practices in Busega wetland.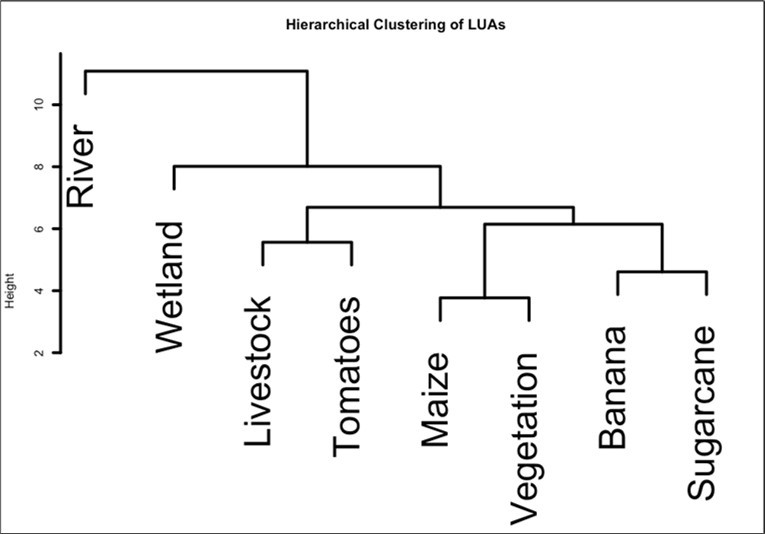
Discussion
Physicochemical properties of water in different land use practices
The results of this study demonstrated that both the chemical and physical water quality properties in the wetland were significantly affected by the agricultural LUPs implemented. Tomato fields and livestock units relatively had a higher pH than other LUPs which could have been influenced by fertilizer application and livestock waste respectively. The fertilizers and livestock waste in return distributed alkaline compounds like Ca hydroxide (lime), ammonium hydroxide and manure into the water system. On the other hand, banana and sugarcane fields had neutral pH values averaging at 6.9 while the maize field and river had slightly alkaline pH values (7.1-7.7). The increase in pH showed a change in water quality suggesting an increase in inputs of dissolved minerals like carbonates into water which may in return affect the biological process in the wetland. The pH values from all LUPs fell within the standard drinking water pH range of 6.5–8.5 45.
The highest TDS and EC identified in the river could be due to high accumulation of dissolved salts from upstream agricultural runoff nutrients such as NH4+-N, NO3--N, PO43--P, SO42-, and Cl found in pesticides, organic and inorganic fertilizers. These EC and TDS results were also confirmed by our Pearson correlation results that showed a positive correlation of Cl with EC and TDS (Figure 4). Our results agree with previous studies that reported increased EC and TDS in rivers due to increased pollutants and ionic compounds in the water from agricultural drainage 23, 24, 46. In contrast, the positive correlation between EC and pH observed by 47 was not observed in our study. The increase in TDS and EC in the river and other water systems can alter the water chemistry, harm the aquatic life, and deteriorate the natural filtration capacity of the wetland.
The increased total hardness observed in the undisturbed LUPs of Ref. wetland and river water was primarily influenced by the presence of dissolved minerals mainly Ca ions. These increased Ca concentrations in the river are due to application of Ca rich fertilizers and mainly from agricultural lands like in maize and tomato fields that contain limestone which dissolves in water through runoff 48 hence elevating hardness levels. These results are supported by the PCA results that showed that the Ref. wetland significantly influenced total hardness concentrations that ranged from 90 – 130 mg/L for all LUPs. A study conducted in India similarly reported high total hardness ranging between 152.20 – 231.19 mg/L that was attributed to leaching and high concentration of ions found in the water 49. Turbidity which indicates water clarity was highest in the Ref. wetland (122 NTU). In the Ref. wetland, water sampling was disrupted due to challenges in accessing the inner pools caused by dense stands of Cyperus papyrus and other aquatic vegetation, which might have increased disturbance and suspended solids in the water. Meanwhile, the high turbidity in the river could have resulted from increased microbial activity and agricultural runoff which resulted in unpleasant and poor oxygenated aquatic habitats 50.
The higher concentrations of COD, BOD, and TOC in the river were attributed to the decomposition of organic matter from agricultural LUPs such as plant residues and the release of organic compounds by microorganisms that get released into the river. Furthermore, algal growth and organic matter decomposition influenced by nutrients like NO3--N from runoff of water in tomato and sugarcane fields contributed to increased COD, TOC, and BOD in the river hence affecting the growth of aquatic animals like amphibians and fish which reduces biodiversity. These high values of COD, BOD and TOC in river water were also supported by our results that showed increased TDS in the river water. High TDS values imply that there are high organic particles in the water that require more oxygen for oxidation causing high COD and BOD concentrations. High COD concentrations (180 - 382 mg/L) and BOD have been linked to increased microorganisms found in the effluent flowing into the river 24.
There were higher DO concentrations detected in water sampled from tomato fields than other LUPs. This could be explained by less waterlogging, fewer decomposing material and agronomic activities like frequent cultivation and controlled drainage systems implemented by tomato farmers enhancing aeration in Lubigi wetland. The lowest DO concentrations in banana fields were influenced by water logging and higher organic decomposition of fallen leaves and roots which are consumed by microorganisms that may result in wetland water quality deterioration.
Nutrient levels, N, P, and K in water, and potential water pollution
The high concentration of NO3--N in the agricultural fields of tomatoes and sugarcane could be as a result of excessive fertilizer and pesticide application. Most farmers apply fertilizers such as urea, which contains N in the form of nitrate (NO₃⁻), a preferred nutrient for vegetables 51 and tomatoes. Additionally, the use of diammonium phosphate (DAP) to promote plant growth contributes to phosphate accumulation in soils 52. Runoff from these agricultural fields can introduce organic matter into water systems, leading to elevated BOD, COD, and EC as bacteria consume oxygen during decomposition. These low oxygen levels result in hypoxic conditions that may stress aquatic animals and alter the wetland natural system. Our results are supported by several literature indicating that the pursuit of increased sugarcane and tomato yield has encouraged the use of N-based fertilizers such as Urea in encroached wetland areas 53, 54, 55. Our PCA results also explicitly demonstrated that growing tomatoes and sugarcanes increased NO3--N concentrations in water sampled from both fields. The concentration of NO3--N in this study was in the range of WHO’s threshold limit of 50 mg/L for drinking water making it suitable for human use by communities that utilize stream water flowing in the wetland for domestic use if further contamination does not occur 45.
On the other hand, the accumulation of NH4+-N in river water was caused by agricultural runoff through soil erosion and animal fecal matter. The differences in NH4+-N and NO3--N concentrations are strongly influenced by the N cycle involving nitrification and denitrification aided by natural and anthropogenic activities. From this study, more PO43--P concentration was found in the river water, and this could have been caused by agricultural runoff containing phosphatic fertilizers 52 and pesticides that result in eutrophication characterized by algal blooms reducing the water quality and altering the ecosystem. Our study results are in line with several literature that have documented increased phosphate concentrations in the river owing it to phosphatic agrochemical residues flowing into the rivers 17, 56, 57. The higher K concentration in water sampled in tomato fields than other LUPs could be explained by the applied potassic fertilizers and pesticides like potassium bicarbonate consistently applied to meet the high K optimum levels that are required for tomato production 58, 59. However, excessive K ions in water may change the ionic balance of water and increase water salinity hence stress the aquatic organisms and contaminate downstream water in rivers and lakes.
The high concentrations of Cl (125 mg/L) in the river compared to Cl concentrations in the other LUPs could be due to agricultural runoff mainly from maize and tomato fields draining into the waterbody. Similarly, other studies have reported increased accumulation of Cl in rivers 24, 60, 61 and attributed it to the use of chlorinated chemical fertilizers and pesticides. Elevated Cl levels could cause toxicity to aquatic life which depend on freshwater and cause a salty taste to water sources within the wetland making its water unpalatable. However, the Cl levels were within the permissible level by WHO = 250 mg/L for drinking water that is considered safe for human consumption 45. Our results showed higher F concentration in the Ref. wetland than in other LUPs and this could have resulted from wastewater being discharged into the Lubigi wetland.
The increased wetland encroachment by different agricultural LUPs contributes to the high counts of total coliform and E. coli > 2000 CFU/100 mL observed in all water samples in this study. This may have resulted from the application of N and P fertilizers, poor drainage in farms causing water stagnation, the use of raw manure, and the inflow of fecal matter from open defecation by animals, which promotes bacterial growth in wetland water. In addition, the high microbial populations could be due to the increased temperatures of wetland water and the decomposition of organic materials from human-introduced manure and plants. The increased E. coli in wetlands is influenced by the presence of livestock fecal matter, hardy E. coli strains that can grow on organic materials and increased total suspended solids 62, 63. This increased microbial community may deteriorate the quality of water infiltrating into the spring wells in the wetland and this may harm the aquatic ecosystem due to oxygen depletion and also pose a health risk to the people depending on these water sources for drinking and domestic purposes.
Our cluster analysis reveals that anthropogenic activities within the wetland significantly influence the relationships between land use practices (LUPs) and water quality parameters, thereby altering nutrient distribution. This study also demonstrates that LUPs impact the nutrient status and physical water parameters of the wetland potentially leading to long-term negative effects on the nearby water resources dependent on this wetland. These anthropogenic activities include high population density, urbanization, solid waste disposal, detergent foam discharge, sewage effluents, industrial discharges, and the application of fertilizers and manure. This study was conducted during a single season, highlighting the need for further research to understand the temporal variability of water quality parameters.
Implications and recommendations
The ongoing encroachment of the wetland by agricultural LUPs demonstrates significant potential for deteriorating wetland quality. Onsite, we observed severe wetland area loss due to intensification of agricultural LUPs such as farming (maize, sugarcane, banana, and tomatoes) and livestock grazing. The water quality within and downstream of the wetland may have declined due to the gradual reduction in the wetland's natural filtration capacity, which is a result of the ongoing destruction of wetland vegetation, including species such as Echinochloa pyramidalis, Cyperus papyrus, Thelypteris acuminata, and Paspalum crobiculatum, for agricultural purposes 3. In some LUPs such as the banana plantation, low concentrations of DO indicate oxygen depletion from pollution and organic matter degradation which results in stunted growth of aquatic life. Excessive NH4+-N and NO3-N nutrient levels suggest the overuse of fertilizers which may subsequently raise the danger of eutrophication in Lubigi wetland. The high BOD and COD readings indicated the presence of organic contaminants primarily from water draining from crop fields and livestock waste units which could disrupt the aquatic life. Without mitigation measures, fisheries and aquatic biodiversity may face threats from increased siltation and nutrient loading. Additionally, deterioration of water quality parameters such as total coliform and E. coli may adversely impact community livelihoods, particularly those dependent on wetland resources for fishing and water supplies. Currently, it is imperative to implement best management practices to preserve this wetland’s ecosystem. To prevent additional encroachment, we suggest establishment of buffer zones that prohibit agricultural activities to avoid nonpoint source pollution from fertilizer runoff 64. The Wetland policy emphasizes the need of degraded areas to be restored by implementing wetland management like planting of native vegetation and creating awareness amongst farmers about their conservation 65. Furthermore, natural water flows blocked by farms should be rehabilitated to allow free wetland cleaning. Water balance and chemical integrity of LUPs adjacent to wetlands can be enhanced through fostering the use of climate-smart agriculture practices such as controlled fertilizer application, promotion of biological pest control, and implementation of livestock waste management techniques such as biogas digesters and manure pits to minimize environmental degradation 66. Our study's suggestions for improving wetland sustainability align with the National Environment Act, which promotes integrating agricultural development with environmental conservation, focusing on reducing wetland pollution and raising awareness about natural resource preservation 67. Further investigation is imperative into the long-term effects of encroachment on biodiversity, the impacts of wetland degradation on downstream water bodies concerning pollution transport, and the influence of wetland degradation on groundwater recharge, particularly in regions near the wetland that rely on spring wells. Additionally, digital mapping of affected areas is essential for the effective implementation of restoration measures.
Conclusion
This study demonstrated that agricultural LUPs inconsistently affected water quality parameters, including DO, organic matter, and nutrient levels. Tomato, sugarcane farming, and livestock areas had variations in DO, N species, potassium, and turbidity concentrations. High levels of BOD, COD, and TOC were identified in the river which showed increased organic pollutants from agricultural runoff. Banana and maize fields had low DO concentrations, showing potential oxygen depletion due to the accumulation of organic matter. Bacterial contamination in all LUPs was > 2000 CFU/100 ml indicating excessive bacterial growth which might deplete oxygen levels and threaten aquatic life. The results of our PCA, Pearson correlations and cluster analysis illustrated that there are variations from each LUP with the river water strongly impacting nutrient loading and organic matter. Livestock and crop fields impacted significantly on N and dissolved ions. Without intervention, continuous agricultural practices in the wetland are likely to exacerbate the degradation of Lubigi wetland by altering water quality parameters hence causing harm to the environment and human health. The deteriorating water quality could lead to degradation of the ecosystem, biodiversity loss and pose a public health risk to individuals depending on the water resources like spring wells in or near the wetland. To mitigate these impacts, we recommend implementing best management practices (BMPs) such as buffer strips, planting native vegetation like Cyperus papyrus, restoring natural water flows, and adopting conservation tillage in areas adjacent to the wetland. Our research underscores the critical importance of implementing BMPs to protect the vital Lubigi wetland ecosystem for future generations.
Conflicts of Interest
The authors declare no competing interests regarding publication of this paper.
Acknowledgements
Christine Atugonza: Data curation; investigation; methodology; writing—original draft; writing —review and editing. Doreen Mbabazize: investigation; validation; writing—original draft; writing —review and editing. BrianZebosi: formal analysis, writing—review and editing. DanielIku Abuni: Data curation; investigation; writing—review and editing. Sylvia Nyamaizi: Conceptualization; formal analysis; investigation; funding acquisition; project management; supervision; writing—original draft; writing—review and editing. AC and DM would like to acknowledge Dr. Sylvia Nyamaizi from The University of British Columbia for funding this study through the Land Use Effects on Soil and Water Quality (LUESAW) project in Uganda, Africa.
References
- 1.CSS Ferreira, Kašanin-Grubin M, Solomun M K, Sushkova S, Minkina T et al. (2023) Wetlands as nature-based solutions for water management in different environments. Curr Opin Environ Sci Heal. 33, 100476.
- 2.Asare E, Chrystal M P, Erik A, Kenneth B, Robert C. (2022) Evaluating ecosystem services for agricultural wetlands: A systematic review and meta-analysis. Wetl Ecol Manag. 30(6), 1129-49.
- 3.Abuni D I, Nyamaizi S, Mbabazize D, Atugonza C. (2025) Effect of Different Land Use Types on Nutrient Distribution across Soil Depth in Busega Wetland. , Uganda. Open 15(1), 84-101.
- 4.Aryal K, Ojha B R, Maraseni T. (2021) Perceived importance and economic valuation of ecosystem services in Ghodaghodi wetland of Nepal. Land use policy. 106-105450.
- 5.Walakira P, Gichuki C, Muriuki J, Ndunda E, Kasoma P et al. (2024) . Spatio-temporal Dynamics of Land Use/Cover Change and Associated Carbon Stocks in Kanyabaha Wetland in Rukiga District, Uganda. J Glob Agric Ecol 16-4.
- 6. (2025) United Development Programme Nations. Safeguarding wetlands [Internet]. Available from: https://www.undp.org/stories/safeguarding-wetlands.
- 8.Saalidong B M, Aram S A, Otu S, Lartey P O. (2022) Examining the dynamics of the relationship between water pH and other water quality parameters in ground and surface water systems. PLoS One. 17-1.
- 9.Akhtar N, Syakir Ishak MI, Bhawani S A, Umar K. (2021) Various natural and anthropogenic factors responsible for water quality degradation: A review. , Water 13(19), 2660.
- 10.Haque S E. (2021) How effective are existing phosphorus management strategies in mitigating surface water quality problems in the US? Sustainability. 13(12), 6565.
- 11.Lei C, Wagner P D, Fohrer N. (2021) Effects of land cover, topography, and soil on stream water quality at multiple spatial and seasonal scales in a German lowland catchment. Ecol Indic. 120-106940.
- 12.N De Troyer, Mereta S T, PLM Goethals, Boets P. (2016) Water quality assessment of streams and wetlands in a fast growing east African. 8-4.
- 13.Nafi’Shehab Z, Jamil N R, Aris A Z, Shafie N S. (2021) Spatial variation impact of landscape patterns and land use on water quality across an urbanized watershed in Bentong, Malaysia. Ecol Indic. 122-107254.
- 14.Shukri A A, Kyambadde J, Hawumba J F. (2017) The impact of Kalerwe abattoir wastewater effluent on the water quality of the Nsooba Channel. Agric Res Technol Open Access. 6, 555677.
- 15.Munishi L K, Blake W, Comber S, Hutchinson T H, Ndakidemi P A. (2022) Towards sustainability: Threat of water quality degradation and eutrophication in Usangu agro-ecosystem Tanzania. Mar Pollut Bull. 181-113909.
- 16.Singh Y, Singh G, Khattar J S, Barinova S, Kaur J et al. (2022) Assessment of water quality condition and spatiotemporal patterns in selected wetlands of Punjab, India. Environ Sci Pollut Res. 29(2), 2493-509.
- 17.Akinnawo S O. (2023) Eutrophication: Causes, consequences, physical, chemical and biological techniques for mitigation strategies. Environ Challenges. 12, 100733.
- 18.J G Omagor, Bernard Barasa, Gideon O J, Bernard B. (2018) Effects of human wetland encroachment on the degradation of Lubigi wetland system, Kampala City Uganda. Environ Ecol Res. 6(6), 562-70.
- 19.Kayima J K, Mayo A W, Norbert J. (2018) Ecological characteristics and morphological features of the Lubigi Wetland in Uganda. Environ Ecol Res. 6(4), 218-28.
- 20.Kayima J K, Mayo A W. (2020) Nitrogen removal buffer capacity of the Lubigi wetland in Uganda. Phys Chem Earth, Parts A/B/C [Internet]. Available from: https://www.sciencedirect.com/science/article/pii/S1474706519301329 117-102883.
- 21.Odeke C. Uganda. Kyambogo University (2019) Wetland degradation and carbon sequestration potential–a case of Lubigi wetland. (un published work);
- 22.Twesigye C, Igunga K, Nakayinga R.Effect of Land Use Activities on Water Quality and Vegetation Cover Change in Nsooba-Lubigi Wetland System. , Kampala City, East African J Biophys Comput Sci 5(2), 13-28.
- 23.Rusydi A F. (2018) Correlation between conductivity and total dissolved solid in various type of water: a review. , IOP Conf Ser Earth Environ Sci 118.
- 24.Rahman A, Jahanara I, Jolly Y N. (2021) Assessment of physicochemical properties of water and their seasonal variation in an urban river in Bangladesh. Water Sci Eng. 14(2), 139-48.
- 26.Soballe D M, Fischer J R. (2004) Long term resource monitoring program procedures: water quality monitoring.
- 27.Howard C S. (1933) Determination of total dissolved solids in water analysis. Ind Eng Chem Anal Ed. 5-1.
- 28. (1993) Environmental Monitoring Systems Laboratory C. Methods for the determination of inorganic substances in environmental samples. Vol. 600. United States Environmental Protection Agency, Office of Research and …; .
- 29.Diehl H, Goetz C A, Hach C C. (1950) The versenate titration for total hardness. , J Am Water Works Assoc 42-1.
- 30.Solorzano L. (1969) Determination of ammonia in natural waters by the phenolhypochlorite method 1 1 This research was fully supported by. US Atomic Energy Commission Contract No. ATS (11‐1) GEN 10, PA 20. Limnol Oceanogr 14(5), 799-801.
- 31.Kamphake L J, Hannah S A, Cohen J M. (1967) Automated analysis for nitrate by hydrazine reduction. Water Res. 1(3), 205-16.
- 32.Sheen R T, Kahler H L, Ross E M, Betz W H, Betz L D. (1935) Turbidimetric determination of sulfate in water. Ind Eng Chem Anal Ed. 7(4), 262-5.
- 33.Rice E W, Baird R B, Eaton A D, Clesceri L S. (2012) Standard methods for the examination of water and wastewater.
- 34.Zall D M, Fisher D, Garner M Q. (1956) Photometric determination of chlorides in water. Anal Chem. 28(11), 1665-8.
- 35.Megregian S, Maier F J. (1952) Fluorides SMS on. Modified Zirconium-Alizarin Reagent for Determination of Fluoride. in Water [with Discussion]. J Am Water Works Assoc 239-48.
- 36.Katz H, Navone R. (1964) Method for simultaneous determination of calcium and magnesium. Journal‐American Water Work Assoc. 56(1), 121-3.
- 39.Mitchell T O. (2006) Luminescence based measurement of dissolved oxygen in natural waters. , Loveland, CO
- 40.Young J C, McDermott G N, Jenkins D. (1981) Alterations in the BOD Procedure for the 15th Edition of" Standard Methods for the Examination of Water and Wastewater". J (Water Pollut Control Fed. 1253-9.
- 41.Canelli E, Mitchell D G, Pause R W. (1976) An improved determination of chemical oxygen demand in water and wastes by a simplified acid dichromate digestion. Water Res. 10(4), 351-5.
- 42.Grant M A. (1997) A new membrane filtration medium for simultaneous detection and enumeration of Escherichia coli and total coliforms. Appl Environ Microbiol. 63(9), 3526-30.
- 43.Lê S, Josse J, Husson F. (2008) FactoMineR: an R package for multivariate analysis. J Stat Softw. 25-1.
- 44.R. (2019) A language and environment for statistical computing. R Found Stat Comput [Internet]. Available from: https://r-project.org/.
- 45. (2022) World Health Organization. Guidelines for drinking-water quality: incorporating the first and second addenda. World Health Organization.
- 46.Helard D, Indah S, Wilandari M. (2021) Spatial variation of electrical conductivity, total suspended solids, and total dissolved solids in the Batang Arau River, West Sumatera. IOP Conference Series: Materials Science and Engineering. IOP Publishing; , Indonesia. In: 12027.
- 47.Bano H, Malik S, Rather R A, JIA Bhat, Islam S et al. (2022) Impact of anthropogenic activities on physico-chemical properties of sediment of Hokersar wetland: a protected wildlife reserve (Ramsar Site No. 1570) of Kashmir Himalaya. , Bangladesh 51(1), 83-92.
- 48.Nyamaizi S, Messiga A J, Cornelis J T, Smukler S M.Effects of increasing soil pH to near-neutral using lime on phosphorus saturation index and water-extractable phosphorus. , Can J Soil Sci 102(4), 929-45.
- 49.Kumar M P, Prabhahar C.Physico-chemical parameters of river water: a review. , Int J Pharm Biol Arch 2012, 1304-12.
- 50.Lemma B, Tesfaw B, Desta H, Tessema B. (2024) Studies on the conservation and sustainability challenges of the wetland resources of the Baro-Akobo River Basin in Gambella and Benishangul-Gumuz regions. , Ethiopia. Heliyon 10-15.
- 51.Messiga A J, Nyamaizi S, Yu S, Dorais M.Blueberry yield and soil mineral nitrogen response to nitrogen fertilizer and nitrification inhibitors under drip-fertigation systems. , Agronomy 11(11), 2144.
- 52.Nyamaizi S, Messiga A J, Cornelis J T, Smukler S M, Cade-Menun B J. (2024) Mineral phosphorus fertilization for silage corn in manured soils in the Fraser. , Valley, Canada. Agron 116(1), 362-79.
- 53.Wu Y, Si W, Yan S, Wu L, Zhao W et al. (2023) Water consumption, soil nitrate-nitrogen residue and fruit yield of drip-irrigated greenhouse tomato under various irrigation levels and fertilization practices. Agric Water Manag. 277-108092.
- 54.Chattopadhyay S, Kumar A, Singh S K. (2021) Nitrate Leaching and threat of Ground Water Contamination in Sugarcane Based Cropping System of Bihar. Agric Food E-Newsletter. 369-72.
- 55.Craswell E. (2021) Fertilizers and nitrate pollution of surface and ground water: an increasingly pervasive global problem. SN Appl Sci. 3-4.
- 56.Usman M O, Aturagaba G, Ntale M, Nyakairu G W. (2022) A review of adsorption techniques for removal of phosphates from wastewater. Water Sci Technol. 86(12), 3113-32.
- 57.Wei K, Zeng X, Wang C, Peng Z, Wang J et al. (2021) Phosphate distribution and sources in the waters of Huangbai River, China: using oxygen isotope composition of phosphate as a tracer. Environ Sci Pollut Res. 28, 29732-41.
- 58.Qu Z, Chen Q, Feng H, Hao M, Niu G et al. (2022) Interactive effect of irrigation and blend ratio of controlled release potassium chloride and potassium chloride on greenhouse tomato production in the Yellow River Basin of China. Agric Water Manag. 261-107346.
- 59.Bodale I, Mihalache G, Achiţei V, Teliban G C, Cazacu A et al.Evaluation of the nutrients uptake by tomato plants in different phenological stages using an electrical conductivity technique. , Agriculture 11(4), 292.
- 60.Petruck A, Stöffler U. (2011) On the history of chloride concentrations in the River Lippe (Germany) and the impact on the macroinvertebrates. Limnologica. 41(2), 143-50.
- 61.Stets E G, Lee C J, Lytle D A, Schock M R. (2018) Increasing chloride in rivers of the conterminous US and linkages to potential corrosivity and lead action level exceedances in drinking water. Sci Total Environ. 613-1498.
- 62.Stott R, JPS Sukias, McKergow L A, Davies-Colley R J, Tanner C C. (2023) Net export of E. coli from a constructed wetland treating agricultural drainage. Ecol Eng. 194-107023.
- 63.Harrow-Lyle T J, Chomicki K M, Kirkwood A E. (2024) Coastal wetlands as sources of Escherichia coli to the nearshore of Lake Ontario. J Great Lakes Res. 50(2), 102292.
- 64.Commons A L, Uri F, Gazette G, Commons A L, Pdf T et al. (2000) National Environment Act. , Kampala, Uganda;
- 65.Ministry of (1995) Natural Resourses. National Policy for the Conservation and Management of Wetland Resources [Internet]. Available from: http://www.ramsar.org/sites/default/files/documents/library/national_wetland_policies_-_uganda.pdf , Kampala, Uganda;